Real interest rates have been driving the pullback in equities and...

Capital Flows@Globalflows
23 views
Nov 24, 2025
~3 min read
1
Real interest rates have been driving the pullback in equities and Bitcoin
You will notice that 2 year real interest rates have begun to drag up credit spreads, which is a very clear signal about how liquidity is impacting risk assets
Here is how to understand this 🧵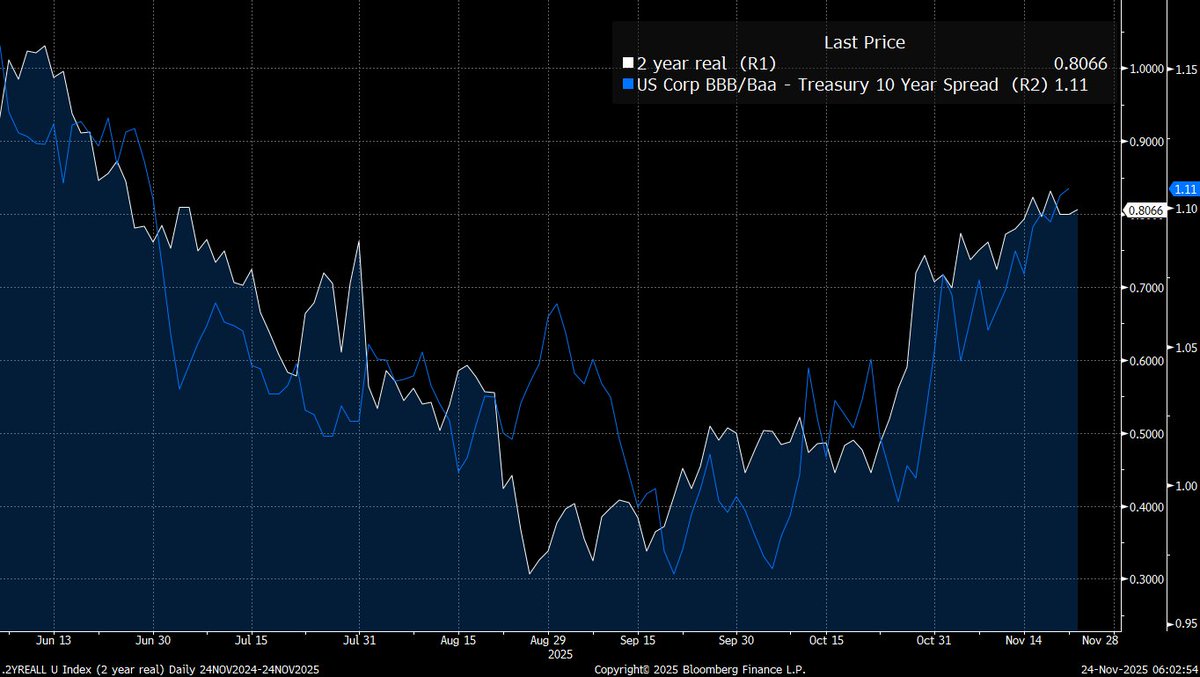
You will notice that 2 year real interest rates have begun to drag up credit spreads, which is a very clear signal about how liquidity is impacting risk assets
Here is how to understand this 🧵
2
Real rates tell you the true cost of money after adjusting for inflation.
Real rate = Nominal yield minus inflation expectations
So real rates move for only two reasons:
- Nominal yields move
- Inflation expectations move
The chart below shows 2 year real interest rates. Notice that they were deeply negative during 2021 when the Fed held rates below inflation. As we moved into the 2022 hiking cycle this reversed. Since this time, we have been normalizing lower.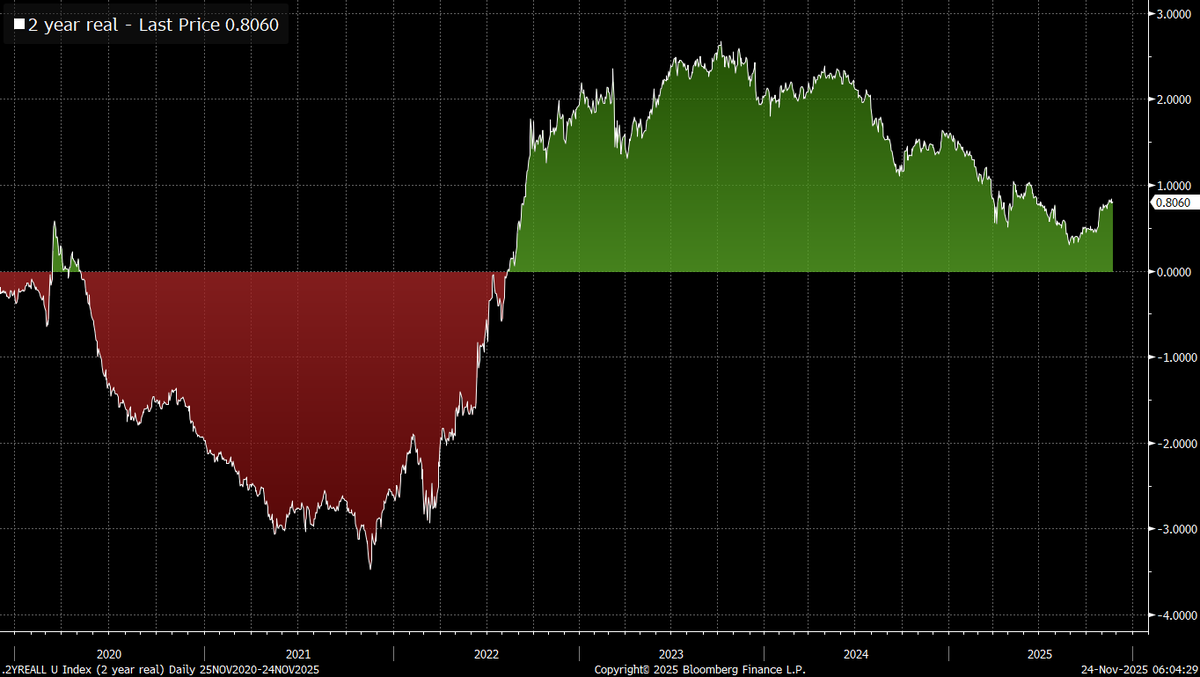
Real rate = Nominal yield minus inflation expectations
So real rates move for only two reasons:
- Nominal yields move
- Inflation expectations move
The chart below shows 2 year real interest rates. Notice that they were deeply negative during 2021 when the Fed held rates below inflation. As we moved into the 2022 hiking cycle this reversed. Since this time, we have been normalizing lower.
3
If nominal yields go up faster than inflation expectations ⇒ real rates rise
If inflation expectations go up faster than nominal yields ⇒ real rates fall
If nominal yields fall and inflation expectations stay the same ⇒ real rates fall
If inflation expectations fall and nominal yields stay the same ⇒ real rates rise (THIS IS WHERE WE ARE)
Everything fits into one idea:
Real rates rising = more expensive money/liquidity in the system on a real basis.
Real rates falling=cheaper money/liquidity in the system on a real basis.
If inflation expectations go up faster than nominal yields ⇒ real rates fall
If nominal yields fall and inflation expectations stay the same ⇒ real rates fall
If inflation expectations fall and nominal yields stay the same ⇒ real rates rise (THIS IS WHERE WE ARE)
Everything fits into one idea:
Real rates rising = more expensive money/liquidity in the system on a real basis.
Real rates falling=cheaper money/liquidity in the system on a real basis.
4
Real rates drive financial conditions. When real rates move, they change:
Capital flows out the risk curve via asset valuations and financial conditions
This is WHY understanding this here is so critical. The higher real rates have begun to drag up credit spreads and move capital back from the risk curve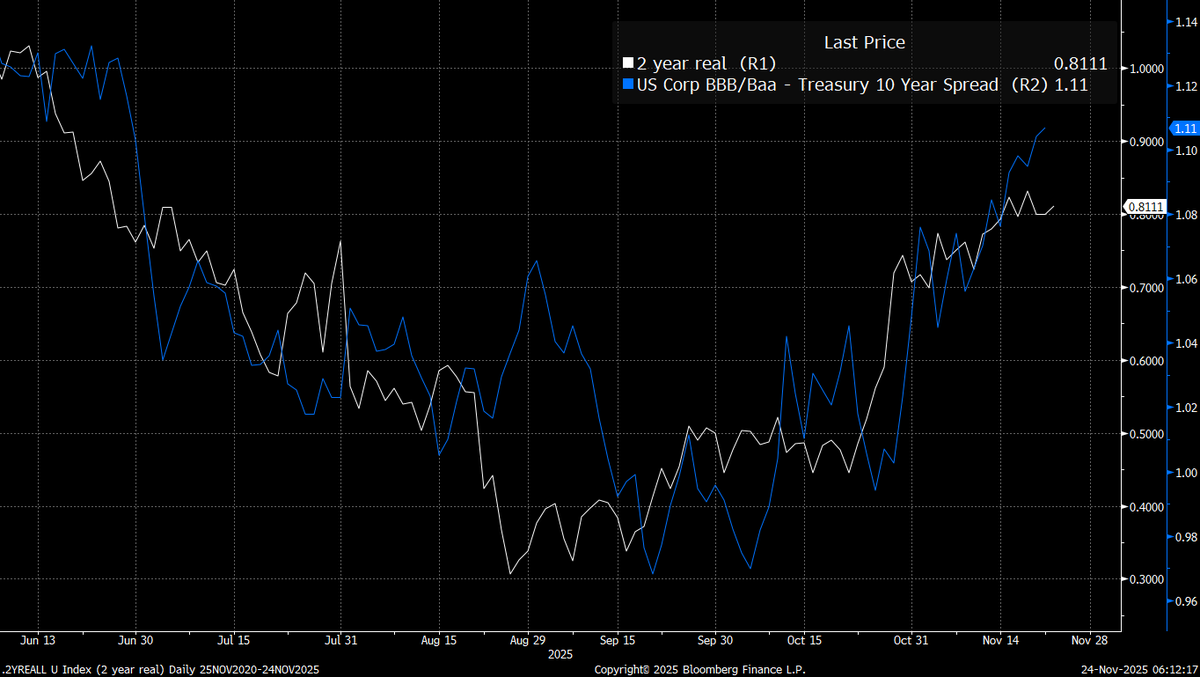
Capital flows out the risk curve via asset valuations and financial conditions
This is WHY understanding this here is so critical. The higher real rates have begun to drag up credit spreads and move capital back from the risk curve
5
The same thing is true for factor rotations of capital moving out of unprofitable tech into megacaps.

6
And the low in real rates marked the high in S&P500 equity breadth

7
This is the actual driver behind Bitcoin right now. Simply put, Bitcoin is the liquidity release valve for the RISK side of macro liquidity. This means that if you go model every single change in Bitcoin, the price of Bitcoin will tell you that its fuctioning as a risk asset.

8
It doesnt matter what other people tell you or what popular narratives tell you, what does the price of Bitcoin tell you about WHAT it is? It is telling you that its a risk asset driven by macro liquidity. The burden of proof is one Bitcoin for it to change.
9
Notice that this is EXACTLY what I laid out in the Bitcoin primer. If real rates are rising and BTC is underperforming equities, there is downside risk. (This primer and the tradingview model to map this is linked here: capitalflowsresearch.com/p/research-syn…)

10
What is the main takeaway? The changes in real interest rates are one of THE most important inputs into macro liquidity driving risk assets. I will be doing a full livestream at US market close today, breaking down these flows and directly connecting them to positioning so you can know WHERE we are likely to go.
Livestream will begin at this link at cash equity close today: youtube.com/live/wLAvLATqj…
Livestream will begin at this link at cash equity close today: youtube.com/live/wLAvLATqj…
11
I will be covering some very helpful models on Bitcoin in the livestream which will be very helpful if you're approaching Bitcoin from a long term allocation perspective
youtube.com/live/wLAvLATqj…
youtube.com/live/wLAvLATqj…