Thread Truncated (Cap Enforced)
Only the first 20 tweets are unrolled into slides to ensure reliable PDF exporting and high server performance.
Canvas & Ratio
Choose your destination platform format
Layout Template
Choose a content structure for your slides
Preset Themes
Typography & Sizing
Brand Kit Customization
AGENCYConfigure brand assets for headers & footers
Outro Slide CTA
Customize your closing call-to-action slide
Background Pattern
Build Your Carousel
Drag and drop any post card below onto a slide, or use the quick buttons to insert content/images instantly!

We are going to break down how quant desks use a piece of 120 year-old math to know when the market is about to change character before the chart shows it & share the exact framework you can run on your own strategies today.

Let's get straight to it….
> <b>Bookmark this.</b> We are the team behind Horizon, the first agentic trading platform: you type a trading strategy in plain English, backtest it in minutes, and deploy it live to your broker. Writing a regime condition into your strategy is a one-sentence job here. Currently in closed beta, launching publicly on July 15. Join the waitlist at horizon.trade or DM @horizon_trade_x for early access.
## <b>Here is the roadmap:</b>
• The prediction quants actually make
• Markov chains and the state you cannot see
• How desks run this on live money
• Where Horizon runs this
• How traders get this wrong
## The prediction quants actually make
Let's kill the myth first, because it is the payoff of this whole framework. Nobody on a desk predicts tomorrow's price. The prediction that works is one level up: what state is the market in, and how likely is that state to change. Markets spend long stretches in recognizable characters: a quiet grind higher, a violent selloff, a directionless range, and each character rewards a completely different strategy. Read the state correctly and an ordinary strategy prints. Misread it and a brilliant strategy bleeds. The 120-year-old math is a machine for reading the state.
## Markov chains in plain terms
The math is Andrey Markov's, published in 1906, and his idea fits in one sentence: the probability of the next state depends only on the current state. Weather makes it intuitive. If today is sunny, there might be an 80% chance tomorrow is sunny and 20% it rains. If today rains, maybe 60% it rains again. Write those numbers in a small table, the transition matrix, and you can compute the long-run behaviour of the entire system from that table alone.
Swap sunny and rainy for market regimes, trend, chop, panic, and two properties of fitted market models do the heavy lifting.
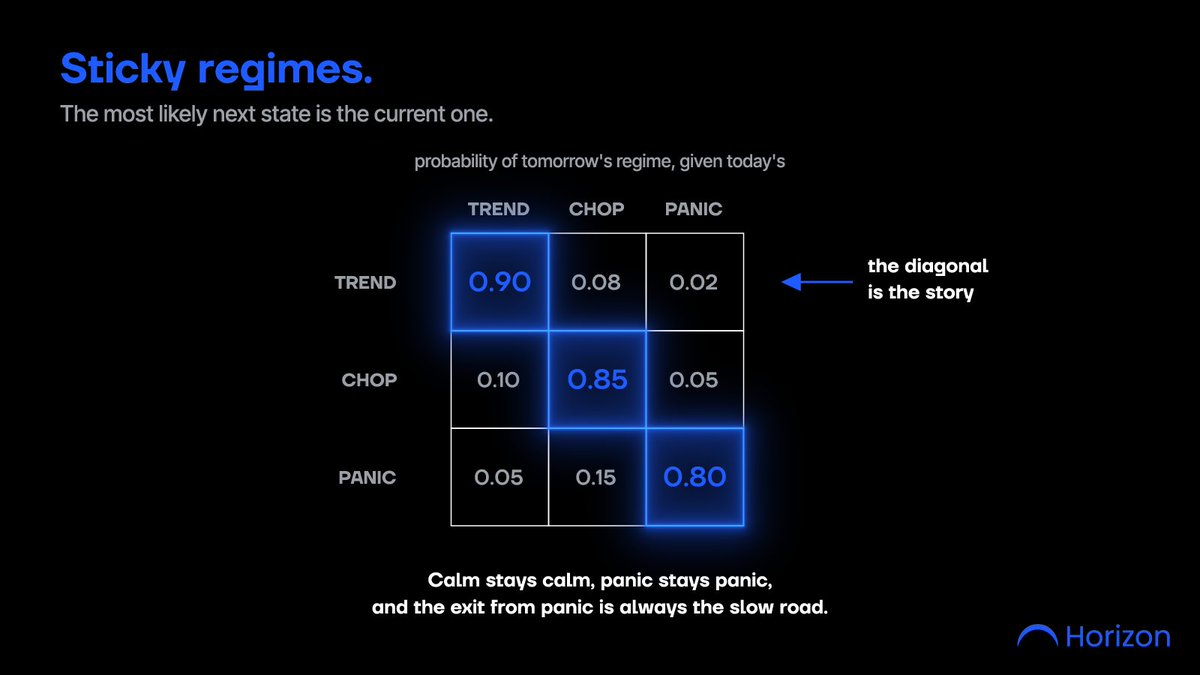
<b>Regimes are sticky.</b> The most likely next state is almost always the current state. Volatile markets tend to stay volatile, quiet markets tend to stay quiet. This is why volatility clusters, and it means today's regime carries real information about tomorrow.
<b>Transitions are asymmetric.</b> The daily probability of jumping from calm to panic is small, but the jump happens fast when it comes. The road back from panic to calm is a slow grind over weeks. The matrix captures this asymmetry as numbers, which is something a moving average will never give you.
## The catch: you cannot see the state
Weather is observable. Market regimes are hidden. Nobody rings a bell when trend turns into chop, and you only see the outputs: returns, volatility, volume.
