Canvas & Ratio
Choose your destination platform format
Layout Template
Choose a content structure for your slides
Preset Themes
Typography & Sizing
Brand Kit Customization
AGENCYConfigure brand assets for headers & footers
Outro Slide CTA
Customize your closing call-to-action slide
Background Pattern
Build Your Carousel
Drag and drop any post card below onto a slide, or use the quick buttons to insert content/images instantly!

ok so for the past week ive been working making feature research as streamlined as possible. the end goal would be just having to design the feature + transformations and ship it through the testing pipeline until it hits the portfolio. i already had a defined method for feature construction, but it was very clunky. also i spent quite a bit of time designing the alternative data part which integrates nicely into the process all the way to the tradable alpha if that makes sense. imagine that you wanna trade some idk weird parking lot data signal on walmart. how do you integrate that data in the pipeline so it doesnt break everything else but can still added to the pool of tradable signals? well that turns out to be a bit more complex than it might appear. so the first thing is getting at an idea of how strong this feature is. right now, and this is not optimal yet, im looking at IC/IR over multiple periods and avging them out. i think this is fine for momo/trend stuff, but for other stuff i cant just avg IC together because features give us different lengths of information depending on what they are targeting right ? i cant be avg a short-term alpha in 60 days when the feature is design to capture short term reversal or carry. so theres nuances ill get into later. also there's other stuff it picks up that we want to neutralize for, and that will be another part of the work. my portfolio still allocates based on feature ranking rather than a forecast over a time horizon if that makes sense. I am not looking each day at what features has the highest EV tomorrow, but rather which features rank highest that day. it should be pretty close to the same thing, but isn't, again especially when new different features hit the portfolio. <a target="_blank" href="https://twitter.com/pedma7/status/2063869516010987756" color="blue">x.com/pedma7/status/…</a>
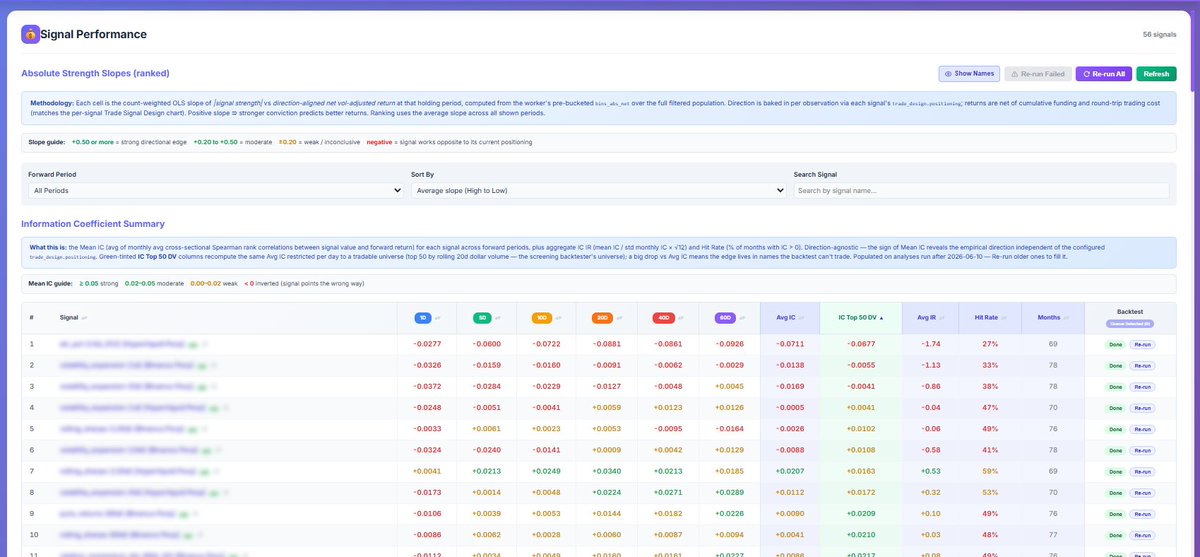
after that it hits the signal screening. whats the purpose of this. I want to know when I run the signal ALONE through my portfolio constructor, risk engine, etc (aka backtestor) what does it look like. i added there on top the avg ic vs sharpe for the purpose that i was not being able to get relevant information from IC to inform sharpe. and i then understood because there was multiple things that happen at the portfolio level, when something is getting close to be traded, that differed from the standard IC information we get. theres still a few things to weed out, but it was way worse than this. right now, avg IC, with a few exceptions, inform pretty well whats the best features in terms of sharpe. these signals are then graduated into the REAL backtester and eventually into the portfolio that will trade it.

all of this process is streamlined in a click of a button after the signal/feature/alpha whatever and data ingestion are designed. i am not data mining here, i want to make that clear, all signals are carefully designed based on some heuristics of why they should work. the idea is to make this process as factory like as possible, and produce as many signals as I can find them. i have a bunch of ideas to get through and efficiency is really important to make it work.