Canvas & Ratio
Choose your destination platform format
Layout Template
Choose a content structure for your slides
Preset Themes
Typography & Sizing
Brand Kit Customization
AGENCYConfigure brand assets for headers & footers
Outro Slide CTA
Customize your closing call-to-action slide
Background Pattern
Build Your Carousel
Drag and drop any post card below onto a slide, or use the quick buttons to insert content/images instantly!

Is it possible to spot a good forecast by its rationale? We used LLMs to score the reasoning behind 55,000+ forecasts and test the link between forecast accuracy and written rationales. We found that: • Causal reasoning is much more prevalent than statistical argumentation • It's easier to identify poor forecasters rather than excellent ones • Human ratings of rationale quality can be unreliable. 🧵A thread on the results:

✍️ Good forecasts often come with rationales—written explanations of the reasoning behind a number. In our studies, we've collected millions of words of rationales, where forecasters explain their logic, cite evidence, and weigh competing considerations. But there are crucial things we don't know about rationales. For example—which features of a rationale are good predictors of forecasting accuracy?
To figure this out, we took the following approach: 1) Defined 60 Explanation Quality Markers (EQMs): features like statistical or fact-based reasoning, guessing, confirmation bias, or extreme confidence. 2) Used an LLM to score rationales against each of the 60 EQMs. 3) Collapsed those 60 scores into a single composite number per rationale. 4) Correlated that composite score with forecasting accuracy.

💻 We ran this pipeline on 55,000 forecast-rationale pairs from the ACE geopolitical forecasting tournament—the IARPA-funded competition that led to @PTetlock's original work on superforecasters. Our key findings were...
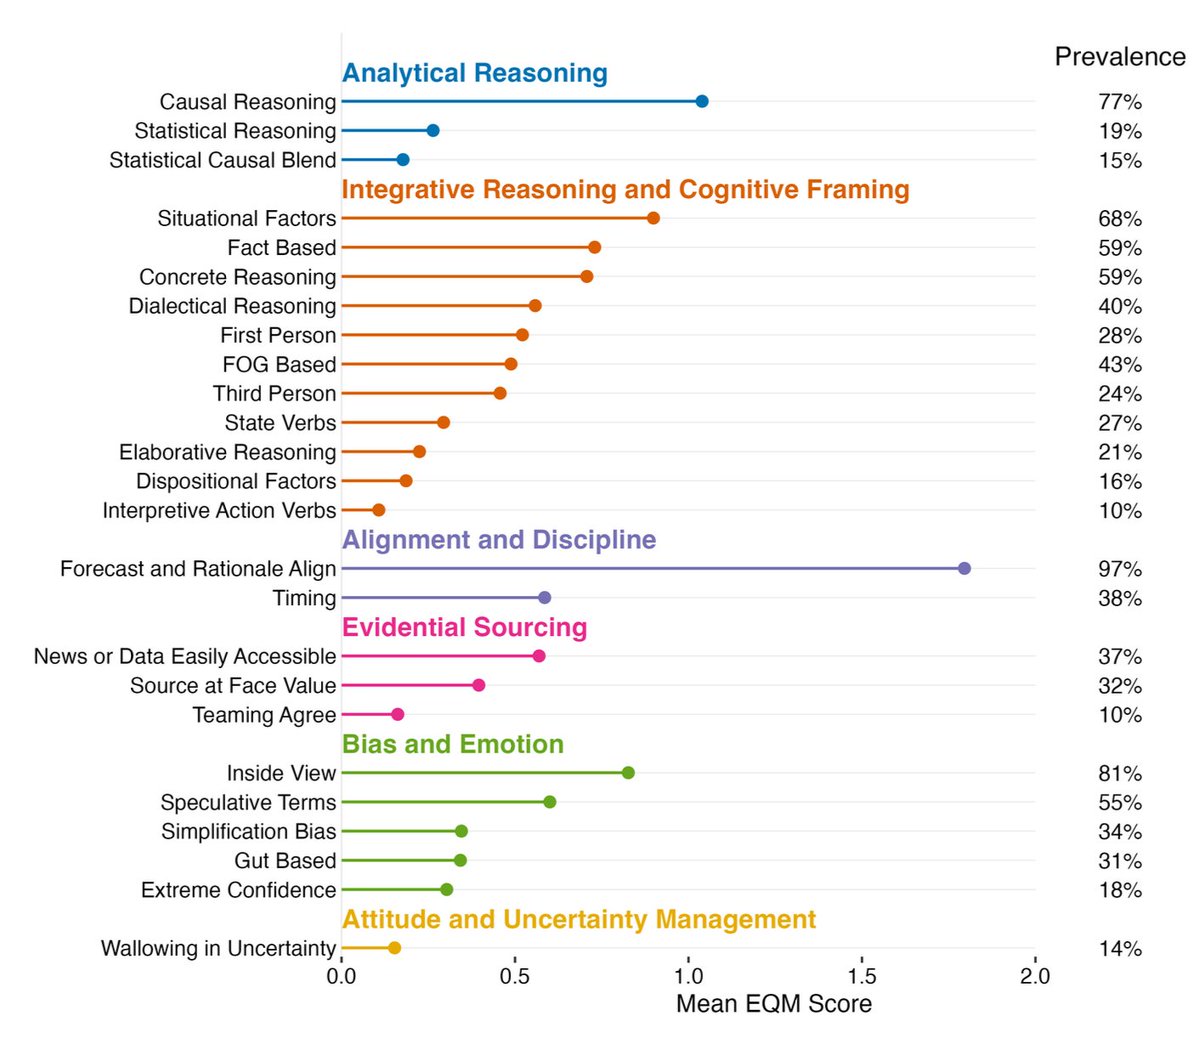
1️⃣ Statistical reasoning is rare In the ACE tournament, forecasters typically expressed their reasoning in causal, not statistical, terms. Share of rationales that featured each EQM: 77% of rationales featured causal reasoning, but only 19% contained statistical reasoning, a 4x difference.
2️⃣ EQMs predict accuracy (with some caveats) We tested whether a forecast's EQM score was predictive of actual forecast accuracy, comparing our new approach with earlier work on scoring rationale quality. We found that the EQM composite score correlated more strongly with forecasting accuracy than a pre-LLM benchmark did.
👍 The following EQMs were positive indicators of forecast accuracy (upper-right quadrant): • Forecast and rationale align • Fact based • Concrete reasoning 👎 These EQMs were negative indicators of accuracy (lower-left quadrant): • Forecast and rationale misalign • Confirmation bias • Extreme confidence

Important caveat: EQMs are more reliable for flagging weak forecasts and forecasters than picking out excellent ones. In other words, EQMs are mostly a screen, not a talent detector. The graph below sorts rationales into nine bins by EQM score. You can see that the biggest jump in accuracy happens across the bottom third of rationales (far left), with minimal gains towards the top.

3️⃣ What looks good to humans isn't always what's accurate We compared human ratings of rationales from the ACE tournament with our EQM scores for the same rationales to find out which ratings were a better predictor of forecast accuracy. We found that EQM scores had a stronger correlation with forecast accuracy than human ratings.
Why was this? As you can see below, human ratings correlate strongly with rationale length, but length is essentially uncorrelated to forecast-level accuracy. Human raters weren’t wrong directionally, but they appeared to place undue weight on some features, such as underweighting "red flags" like extreme confidence.

Thank you to the study's authors: Chris Karvetski, @sicong_huang, @simas_kucinskas, Nadja Flechner, Jingyu Hu, @PTetlock, and @EzraKarger Read more on our Substack: <a target="_blank" href="https://forecastingresearch.substack.com/p/can-you-judge-a-forecast-by-its-rationale" color="blue">forecastingresearch.substack.com/p/can-you-judg…</a> Read the full working paper on SSRN: <a target="_blank" href="https://papers.ssrn.com/sol3/papers.cfm?abstract_id=6862818" color="blue">papers.ssrn.com/sol3/papers.cf…</a>