Canvas & Ratio
Choose your destination platform format
Layout Template
Choose a content structure for your slides
Preset Themes
Typography & Sizing
Brand Kit Customization
AGENCYConfigure brand assets for headers & footers
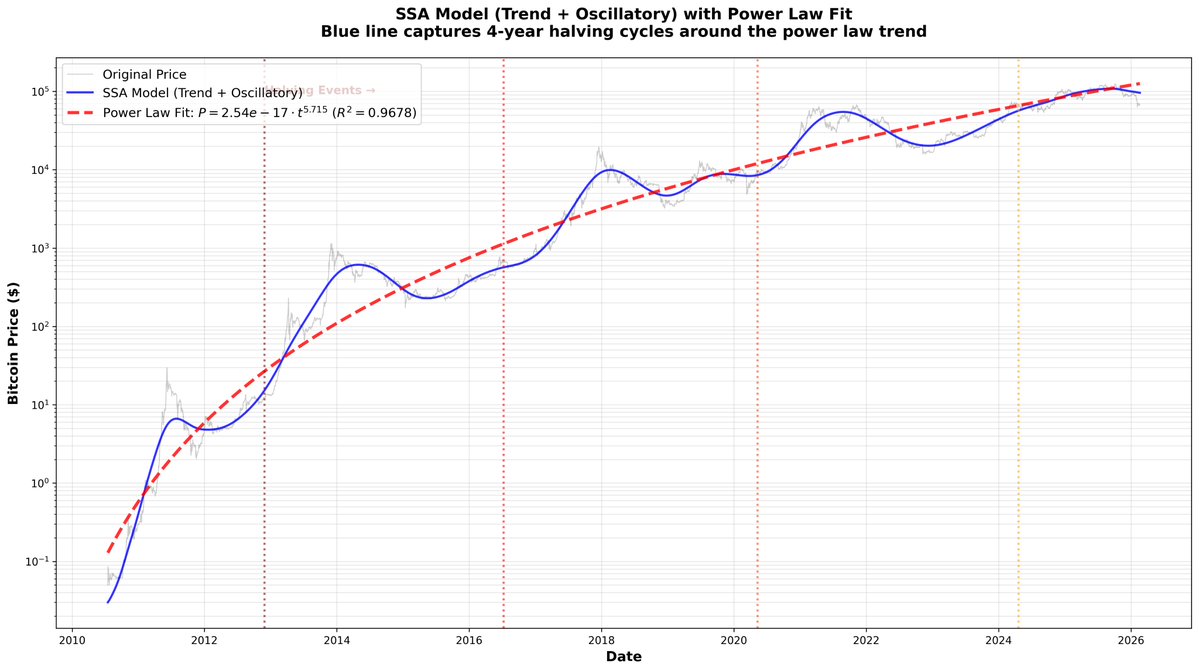
Outro Slide CTA
Customize your closing call-to-action slide
Background Pattern
Build Your Carousel
Drag and drop any post card below onto a slide, or use the quick buttons to insert content/images instantly!

🧵 THREAD: We just proved Bitcoin's 4-year halving cycle is a fundamental eigenmode of the system Using eigenvalue decomposition (SSA + DMD), we discovered something remarkable about Bitcoin's price dynamics. Let me explain what we did and why it matters... 1/ What are eigenvectors? Think of Bitcoin price as a complex signal - like a symphony with multiple instruments playing at once. Eigenvectors are the "fundamental notes" that compose this symphony. Each eigenvector captures a distinct pattern in the data, ranked by importance. 2/ How we found them: Singular Spectrum Analysis (SSA) We worked in LOG SPACE (critical!) because Bitcoin spans 6 orders of magnitude ($0.05 → $125k). We created a "trajectory matrix" from the price history and decomposed it using SVD (Singular Value Decomposition). Think of it as separating the signal into layers. 3/ What we discovered: Eigenvector 1: 98.70% of variance→ This IS the power law: Price ∝ t^5.7 → The fundamental attractor of the system → Bitcoin's "base note" Eigenvectors 2-6: 1.29% of variance→ Oscillations around the trend → This is where the magic happens... 4/ Then we applied Dynamic Mode Decomposition (DMD) DMD extracts the "Koopman eigenvalues" - these tell us the frequencies and growth rates of oscillations. We found: Short cycles: 15-30 days (market microstructure) MODES 5-6: Period = 1,530 days = 4.19 YEARS The halving cycle! 5/ Why this matters: The 4-year cycle isn't just a coincidence or narrative - it's a fundamental eigenmode of Bitcoin's dynamics. Eigenvalue |λ| = 0.9985 (slightly decaying, stable oscillation). It exists as a persistent oscillation in log-space around the power law attractor. 6/ The physics: This is exactly what renormalization group theory predicts for complex systems: A power law fixed point (dominant eigenvalue) Log-periodic oscillations (subdominant eigenvalues) Stable, bounded dynamics (all |λ| ≈ 1) Bitcoin behaves like a critical system near a phase transition. 7/ Why log space was critical: In LINEAR space: 4-year cycle INVISIBLE (buried in noise) In LOG space: 4-year cycle CLEAR (eigenmode 5-6) Why? Halvings affect price MULTIPLICATIVELY (% changes), not additively. Log space reveals the true geometry of the dynamics. 8/ Reconstruction: Blue line = Eigenvector 1 + Eigenvectors 2-6 Red line = Power law fit R² = 0.9678 (better than raw data!) We reconstructed Bitcoin's full price dynamics from just 6 eigenvectors. The math works. The physics checks out. 9/ Bottom line: The Bitcoin power law isn't just a trend line. The 4-year cycle isn't just protocol mechanics. They're fundamental eigenmodes of a complex dynamical system - proven through eigenvalue decomposition. This is physics, not hopium. TL;DR: Decomposed BTC price into eigenvectors (SSA) Found power law = dominant eigenmode (98.7%) Found 4-year halving = oscillatory eigenmode (DMD) Reconstructed full dynamics from 6 components Log space was key Math + physics confirm: Bitcoin is a critical system