Thread Truncated (Cap Enforced)
Only the first 20 tweets are unrolled into slides to ensure reliable PDF exporting and high server performance.
Canvas & Ratio
Choose your destination platform format
Layout Template
Choose a content structure for your slides
Preset Themes
Typography & Sizing
Brand Kit Customization
AGENCYConfigure brand assets for headers & footers
Outro Slide CTA
Customize your closing call-to-action slide
Background Pattern
Build Your Carousel
Drag and drop any post card below onto a slide, or use the quick buttons to insert content/images instantly!

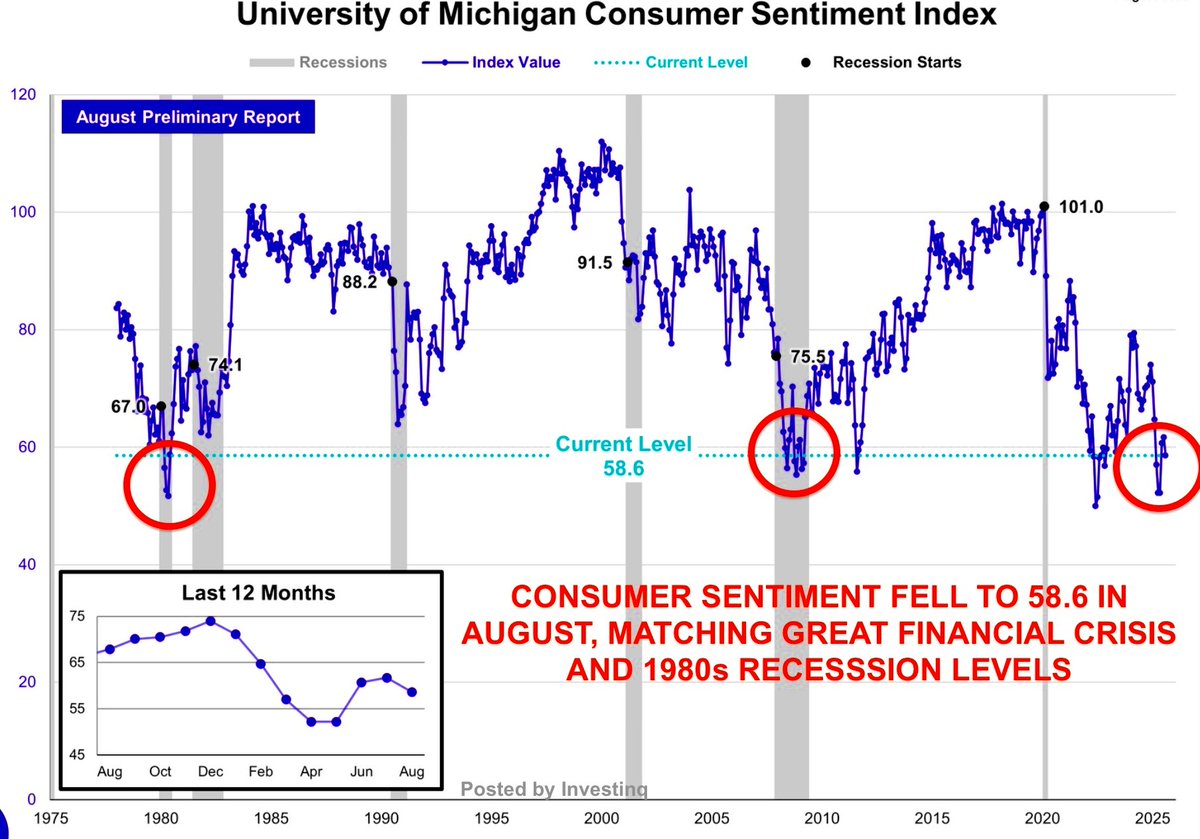
🚨 U.S. consumer confidence just PLUNGED. The Michigan Sentiment Index sank to 58.6 in August, levels not seen outside deep downturns. We’re talking Great Recession + early ’80s crisis territory.
Consumer sentiment ≠ vibes. It’s a monthly national survey that translates household feelings into a number (1966=100). It tracks how secure Americans feel about finances, the economy, and buying conditions. Since consumer spending drives ~70% of GDP, these feelings matter.
Key terms to know: • MCSI = headline Consumer Sentiment Index. • CECI = Current Economic Conditions, how people feel right now about finances & major purchases. • CEI = Consumer Expectations, outlook for household finances & the economy 1–5 years ahead.
How is it built? The survey asks 5 core questions. Each answer is scored as (% favorable – % unfavorable + 100). Those results are averaged into an index. It’s published twice monthly (prelim + final). No seasonal adjustment, it’s raw sentiment turned into economic data.
The August report was brutal: • Index fell to 58.6 from 61.7 in July (–5%). • First decline in 4 months. • Missed forecast of 61.9. • Down 13.7% from last year. • Statistically, it sits in the bottom 3% of all readings since 1978. That’s extremely rare.
A 3.1-point move is about average for this survey, it’s volatile but context is everything. This drop pushed sentiment back into historic lows. Think of a normal-sized wave that still drags you under because you were already standing in very deep water.
Does a 58.6 reading automatically mean recession? No. But history shows: whenever the index is under 60, the U.S. is either already in a downturn or headed for very weak growth. Sub-60 is considered a “danger zone.” Few recoveries hold when confidence is this low.
Breaking down the details: • CECI (current conditions) plunged ~10% to 60.9. • CEI (expectations) slipped to 57.2. In plain terms: Americans say things feel worse today, and they don’t think the outlook is getting better. That double decline is especially worrying.
The most dramatic pain point: buying conditions for durable goods, cars, furniture, appliances, electronics collapsed 14% to the worst in a year. Why? Consumers say prices are still painfully high. Sticker shock hasn’t gone away, and wallets are shutting in response.
How do people view their finances compared to last year? Worse. Paychecks haven’t kept up with inflation. It’s not a total collapse, but a slow grind of lost purchasing power. That erosion eats into appetite for discretionary spending, the lifeblood of cyclical growth.
There was one twist: expected personal finances ticked up a little. Some households see raises or relief ahead but expectations for the broader economy fell. The message is clear: “We might hold up okay, but the economy itself? That’s not looking good.”
Inflation expectations are flashing: • 1-year outlook jumped to 4.9% (from 4.5%). • 5–10 year outlook rose to 3.9% (from 3.4%). When both short and long-run expectations climb together, it’s not just gas prices. It means broad, sticky inflation worries are creeping in.
Why do people expect more inflation? Narratives matter: tariffs (companies pass higher import costs to shoppers), gas (weekly pain at the pump), groceries and rent (still sticky high). These concerns aren’t partisan, they cut across incomes, ages, and political affiliations.
Labor market fears are rising. 62% of households now expect unemployment to go up within a year. Historically, when that many people fear job losses, they cut spending and save more even before layoffs actually occur. Fear itself can change behavior.
A separate report released by the University of Michigan Friday showed 58% of consumers plan to cut back on spending this year as they brace for further inflation. That’s how downturns start. Intentions become behavior → demand weakens → businesses feel the pinch.
Where is pain sharpest? • Autos: high sticker prices, costly loans, and tariff fears. • Appliances/electronics: rising import costs. • Furniture/home projects: housing slowdown + high prices. Top culprit consumers name? Prices. Interest rates come second.
Not all households react the same. Higher-income families often delay purchases, waiting for lower rates or discounts. Lower-income families more often stop completely because credit cards are maxed out and budgets already stretched. That divergence is critical.
Survey timing matters: July 29–Aug 11. This period overlapped with tariff headlines and weaker job reports. That real-world context shaped responses. This isn’t abstract economics, it’s how people react to costs they see daily and news they hear every week.
Historical context: 58.6 is lower than sentiment at the start of every U.S. recession since 1978. It’s ~30% below the long-run average in the 80s. Statistically, it sits in the bottom 3% of all months ever recorded. This is rare, serious territory.
“But July retail sales looked strong!” True. Spending can hold up for a while even when mood tanks, thanks to jobs, summer travel, promotions. But sentiment usually leads behavior. If confidence stays weak, fall spending will almost certainly fade.