Canvas & Ratio
Choose your destination platform format
Layout Template
Choose a content structure for your slides
Preset Themes
Typography & Sizing
Brand Kit Customization
AGENCYConfigure brand assets for headers & footers
Outro Slide CTA
Customize your closing call-to-action slide
Background Pattern
Build Your Carousel
Drag and drop any post card below onto a slide, or use the quick buttons to insert content/images instantly!

K-means is an essential algorithm for Data Science. But it's confusing for beginners. Let me demolish your confusion:

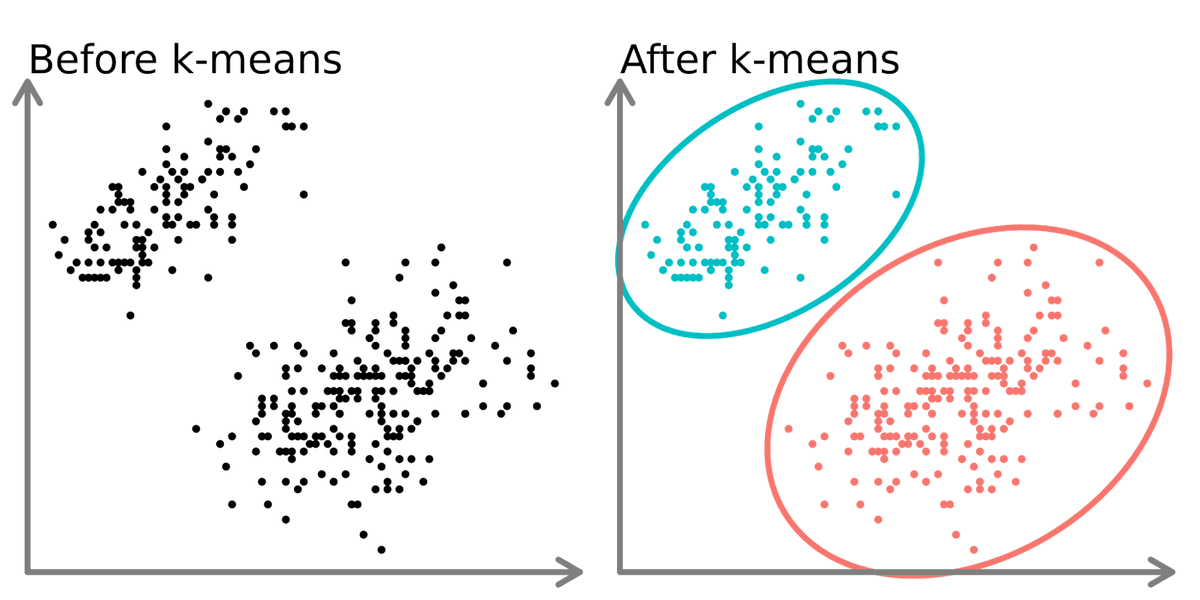
1. K-Means K-means is a popular unsupervised machine learning algorithm used for clustering. It's a core algorithm used for customer segmentation, inventory categorization, market segmentation, and even anomaly detection.
2. Unsupervised: K-means is an unsupervised algorithm used on data with no labels or predefined outcomes. The goal is not to predict a target output, but to explore the structure of the data by identifying patterns, clusters, or relationships within the dataset.
3. Objective Function: The objective of K-means is to minimize the within-cluster sum of squares (WCSS). It does this though a series of iterative steps that include Assignments and Updated Steps.

4. Assignment Step: In this step, each data point is assigned to the nearest cluster centroid. The "nearest" is typically determined using the Euclidean distance.

5. Update Step: Recalculate the centroids as the mean of all points in the cluster. Each centroid is the average of the points in its cluster.
6. Iterate Step(s): The assignment and update steps are repeated until the centroids no longer change significantly, indicating that the clusters are as good as stable. This process minimizes the within-cluster variance.
7. Silhouette Score (Evaluation): This metric measures how similar a data point is to its own cluster compared to other clusters. The silhouette score ranges from -1 to 1, where a high value indicates that the data point is well-matched to its own cluster and poorly matched to neighboring clusters.

8. Elbow Method (Evaluation): This method involves plotting the inertia as a function of the number of clusters and looking for an 'elbow' in the graph. The elbow point, where the rate of decrease sharply changes, can be a good choice for the number of clusters.

9. There's a new problem that has surfaced -- Companies NOW want AI. AI is the single biggest force of our decade. Yet 99% of data scientists are ignoring it. That's a huge advantage to you. I'd like to help.
On Wednesday, June 25th, I'm sharing one of my best AI Projects for FREE: How I built an AI Customer Segmentation Agent with Python: Register here (limit 500 seats): <a target="_blank" href="https://learn.business-science.io/ai-register" color="blue">learn.business-science.io/ai-register</a>

That's a wrap! Over the next 24 days, I'm sharing the 24 concepts that helped me become an AI data scientist. If you enjoyed this thread: 1. Follow me @mdancho84 for more of these 2. RT the tweet below to share this thread with your audience <a target="_blank" href="https://twitter.com/815555071517872128/status/1934574520372793373" color="blue">x.com/81555507151787…</a>