Thread Truncated (Cap Enforced)
Only the first 20 tweets are unrolled into slides to ensure reliable PDF exporting and high server performance.
Canvas & Ratio
Choose your destination platform format
Layout Template
Choose a content structure for your slides
Preset Themes
Typography & Sizing
Brand Kit Customization
AGENCYConfigure brand assets for headers & footers
Outro Slide CTA
Customize your closing call-to-action slide
Background Pattern
Build Your Carousel
Drag and drop any post card below onto a slide, or use the quick buttons to insert content/images instantly!

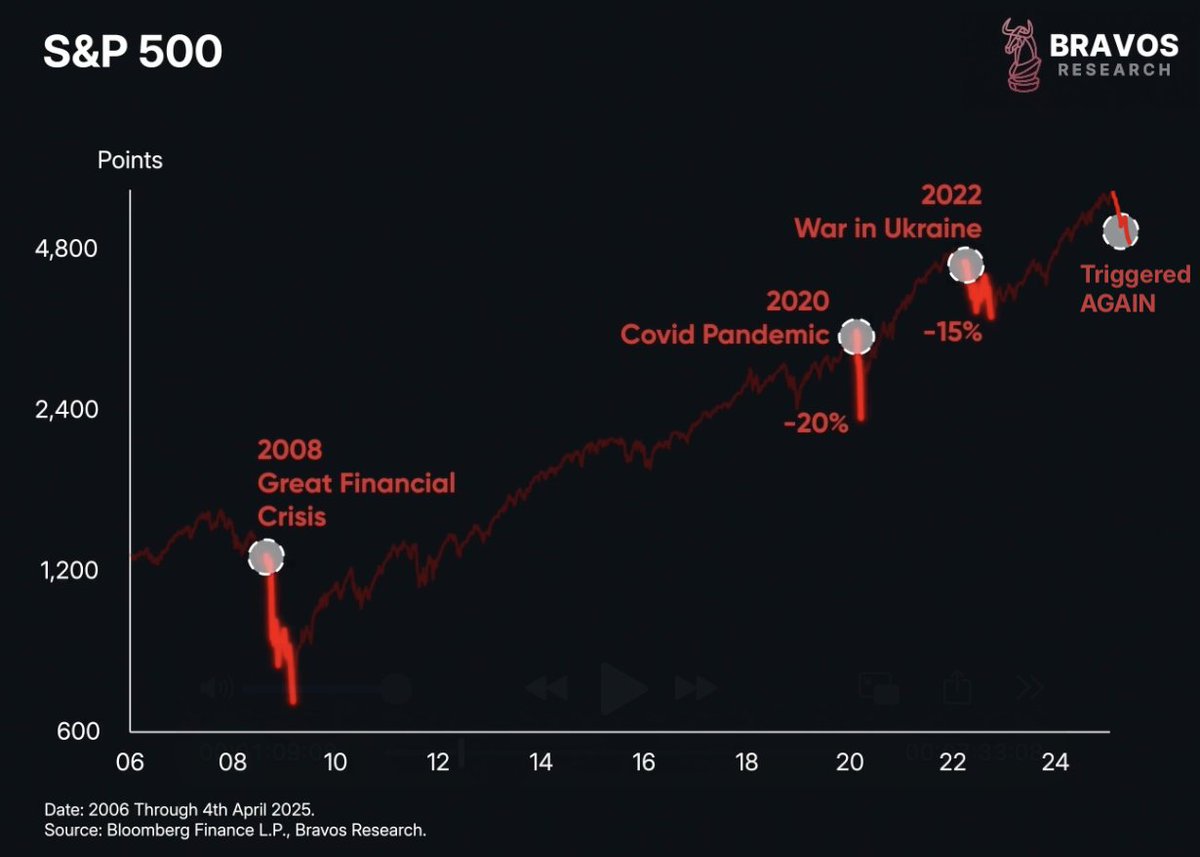
A MAJOR market signal has just flashed This also happened in the 2022, 2020, & 2008 crashes Each of them marked a significant buying opportunity A thread 🧵
2/ The US stock market is in full panic mode In our last YouTube video, we said there was still plenty of short-term downside risk Which is why we removed most of our exposure to US stocks during the recent bounce
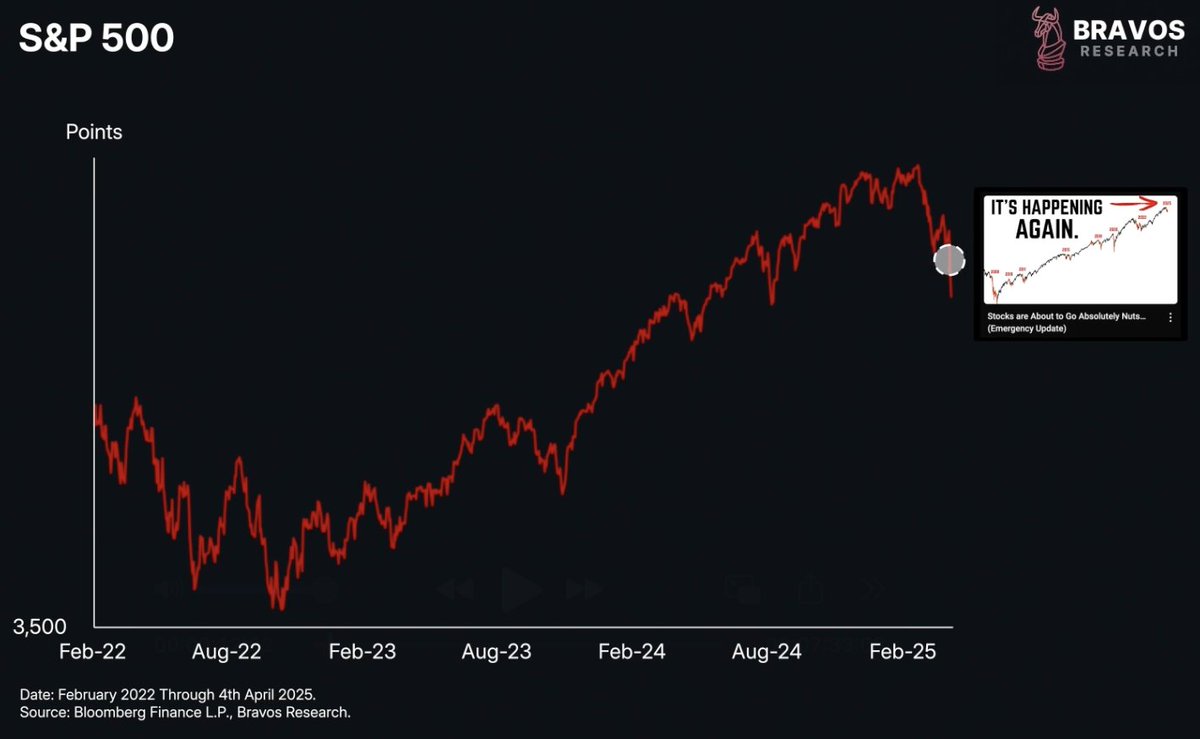
3/ Now yes, the stock market is starting to reach an extreme point of fear and capitulation But we don’t think stocks are quite out of the woods yet One reason is a signal that triggered this week Which also appeared at the start of the 2022, 2020, and 2008 crashes

4/ This isn’t doom and gloom, it’s a real signal that just triggered And we’re factoring this into our analysis We’re going to walk you through the key nuances you need to consider And how we’re approaching this signal with our clients at Bravos Research
5/ By the way, if you want to follow our exact trading strategy, make sure to watch our latest Premium Video We send real-time Trade Alerts on stocks, commodities, and cryptos In 2024, we’ve averaged a 16.65% profit and just a 3.67% average loss Join us now at: <a target="_blank" href="https://bit.ly/BravosResearch" color="blue">bit.ly/BravosResearch</a>
6/ Before I show you exactly what this signal is, we first have to understand the nature of this stock market decline For that, let’s add in Treasury bond yields This matters because bond yields reveal what the market is worried about So whether that’s inflation or slowing economic growth
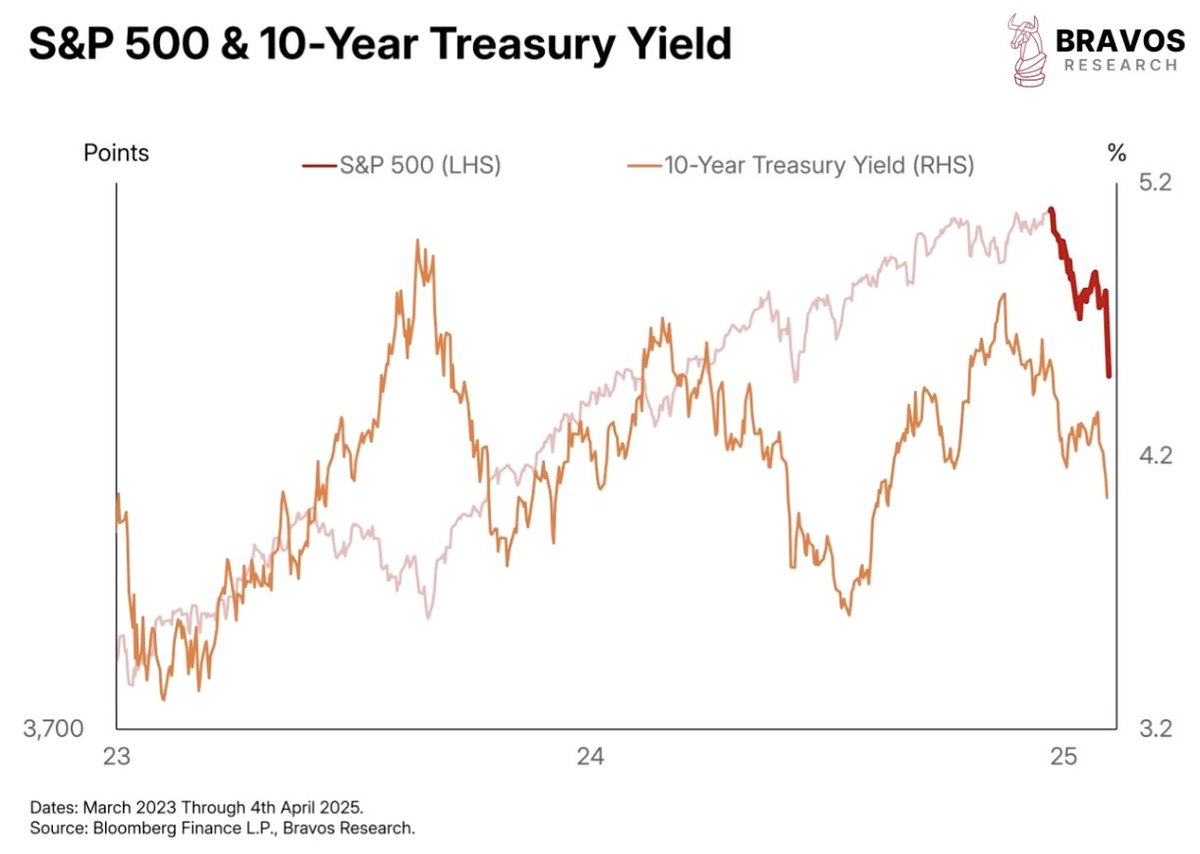
7/ As you can see, bond yields have been declining alongside the stock market during this correction That tells us financial markets are currently more concerned about slowing growth, due to Trump’s tariffs That’s very different from 2022, when yields were rising as inflation was the key concern

8/ The current sell-off looks much more like what we saw in 2020 When bond yields also fell as investors priced in weaker economic growth during the pandemic This distinction matters because growth-driven sell-offs tend to be much more violent

9/ We’ve highlighted every market decline since 2008 that was triggered by lower growth expectations The good news: most didn’t result in a recession The bad news: they were still violent, with 2 non-recession drops over 20%

10/ This is the index that measures S&P 500 volatility (VIX) And in every one of those growth-related declines, the VIX spiked above 35

11/ One thing we’ve been highlighting since this correction began is that the VIX hadn’t hit an extreme panic level We hadn’t yet seen the kind of fear and capitulation that typically are seen near a bottom

12/ Believe it or not, we just got that on Friday VIX has now spiked above 36 Indicating the market is finally hitting the extreme fear zone we’ve seen in past corrections

13/ It’s during moments like these that stocks can see significant damage in a short time as real capitulation sets in That’s why we remain in a defensive posture at Bravos Research We’re not trying to nail the bottom But these volatility spikes often bring long-term buying opportunities

14/ Now, this brings us to the signal that just triggered, one we also saw in 2022, 2020, and 2008 It’s based on the gold-to-silver ratio This is a tool we closely watch to gauge whether markets are in “risk-on” or “risk-off” mode

15/ This is what the gold-to-silver ratio looks like since 2020 It just broke out above a major basing pattern that had been forming since 2022 This is a risk-off signal, showing traders are moving away from the more volatile silver and into gold

16/ In April 2022, we saw a similar breakout in the gold-to-silver ratio This was right at the start of the 2022 bear market With stocks falling another 20% from that point

17/ We also saw a major breakout at the end of February 2020 This was sharp move above a multi-month base in the gold-to-silver ratio

18/ That breakout came right at the start of the COVID crash With stocks dropping another 25% from that moment

19/ Now let’s rewind to 2008 We saw another similar breakout in the gold-to-silver ratio in early August This was just before the S&P 500 by fell another 50%

20/ So this raises the question: are we on the edge of a much larger decline in US stocks? And possibly heading into recession? A 2025 recession hasn’t been our base case And we’ve seen plenty of deep corrections without one
