Thread Truncated (Cap Enforced)
Only the first 20 tweets are unrolled into slides to ensure reliable PDF exporting and high server performance.
Canvas & Ratio
Choose your destination platform format
Layout Template
Choose a content structure for your slides
Preset Themes
Typography & Sizing
Brand Kit Customization
AGENCYConfigure brand assets for headers & footers
Outro Slide CTA
Customize your closing call-to-action slide
Background Pattern
Build Your Carousel
Drag and drop any post card below onto a slide, or use the quick buttons to insert content/images instantly!

My Trading Model and Rationale "SLK" Part 1🧵

SLK - means structure, liquidity and key levels. What is structure? Structure tells us the direction of market. We have Bullish, Bearish and Ranging structure.

Bullish structure Also know as uptrend, is characterised with the continuous creation of higher highs and higher lows. This creation leads to continuous break of structure (BOS) to the upside.

Bearish structure Also known as downtrend, is characterised with the continuous creation of lower hi g s and Lower lows. This creation leads to continuous BOS to the downside.

Ranging market Also known as consolidation. In this case there is no direction of price rather price moves randomly in an unspecified direction. In most scenarios Ranging market signals the transitioning of either uptrend to downtrend or the other way round
Now what is liquidity? Liquidity can be seen as money in the market. In other words, it is where money resides in the market and can be in form of highs and lows of the market depending on the structure. There are various forms of liquidity which include;
Structural liquidity (inducement) - Here the high after the poi/ main high breaks structure. That is the pullback after the first BOS breaks another structure Engineered liquidity - Here the high after the main high does not BOS. The pullback does not break structure


Also previous candles of weekly, daily, 4hr, or 1hr candles can also act as liquidity depending on your market approach.


Finally what is Keylevel? This are specific levels in the market where we expect a reaction of price. We have basically three types of keylevels, which include;

A shaped keylevels used for sells

V haped Key levels for buys

Now let's look at how to spot A and V shaped key levels. •The best way to set them is by using your line chart •For higher probability, go with the ones closest to liquidity


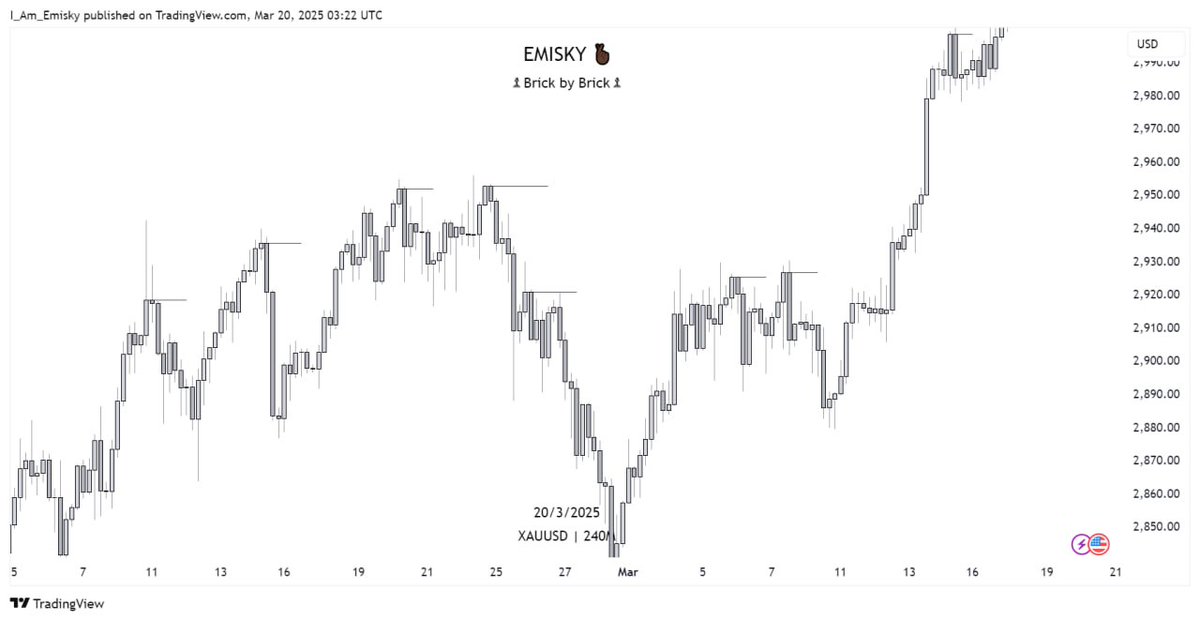
Here are previous price actions on enteries using A and V shaped keylevels for both buys and sells


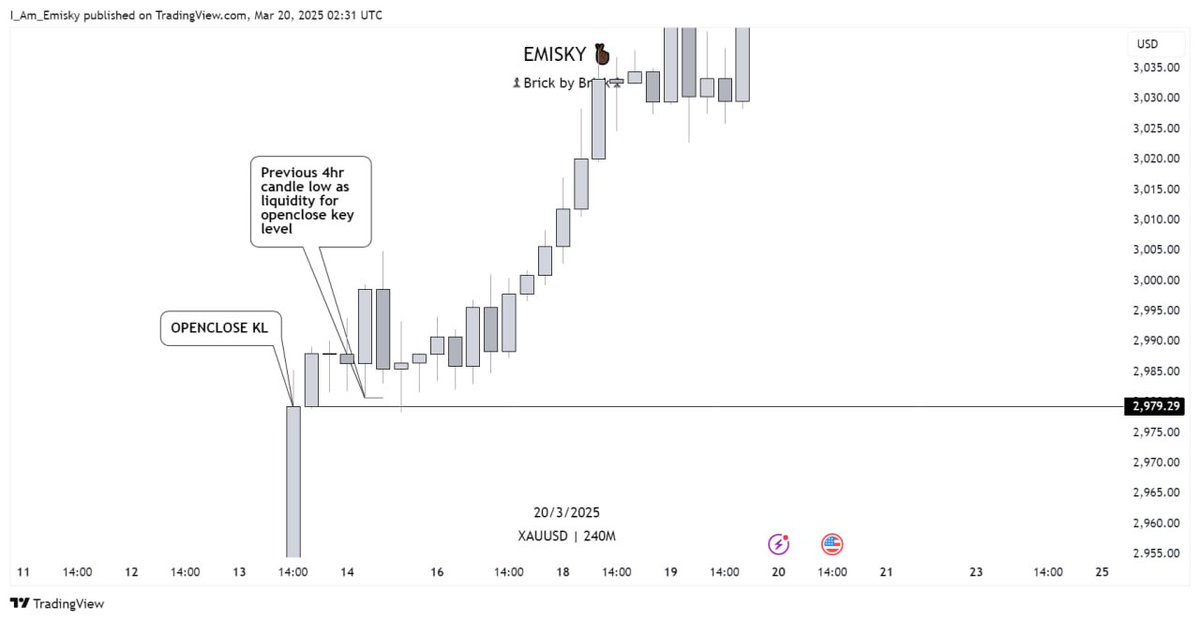
Openclose Keylevels, which consists of ; • Bullish openclose - we buy from it • Bearish openclose - we sell from it


Here are previous price action on enteries using openclose (Bullish and Bearish) Keylevels for both buys and sells


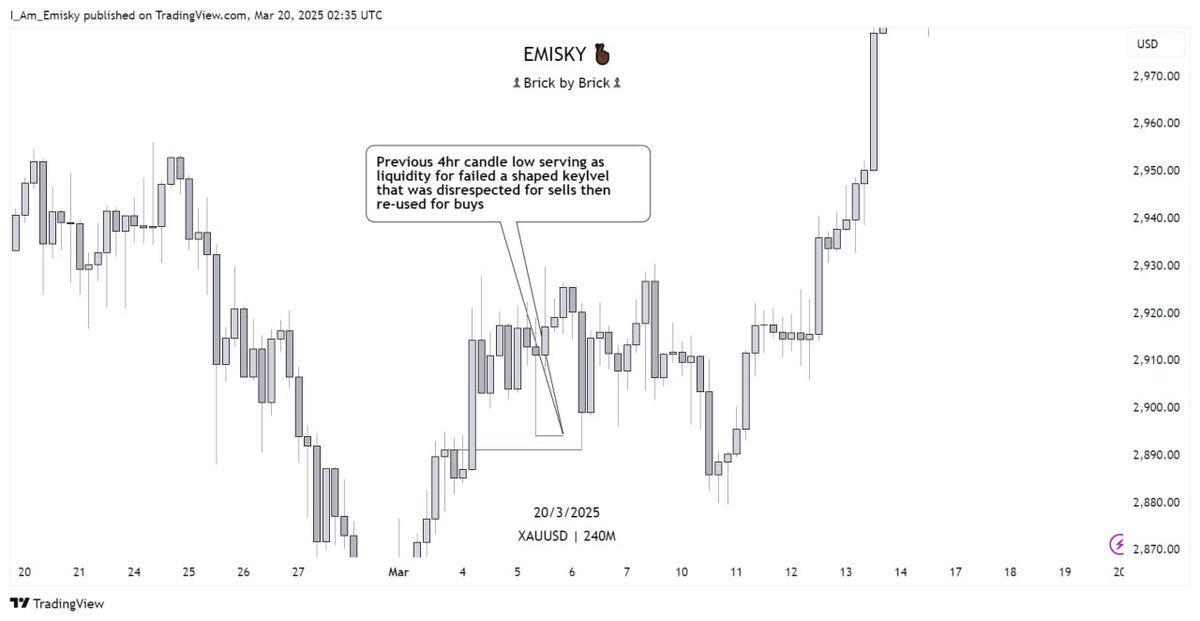
On some other cases an A shaped KL that was supposed to be used for sells if disrespected can be used for buys and also a V shaped KL that is supposed to be used for buys if disrespected, can be used for sells.


Here are some examples Frame 1 : failed A shaped keylevel Frame 2 : failed V shaped keylevel

Same applies to both bullish and bearish open close key levels

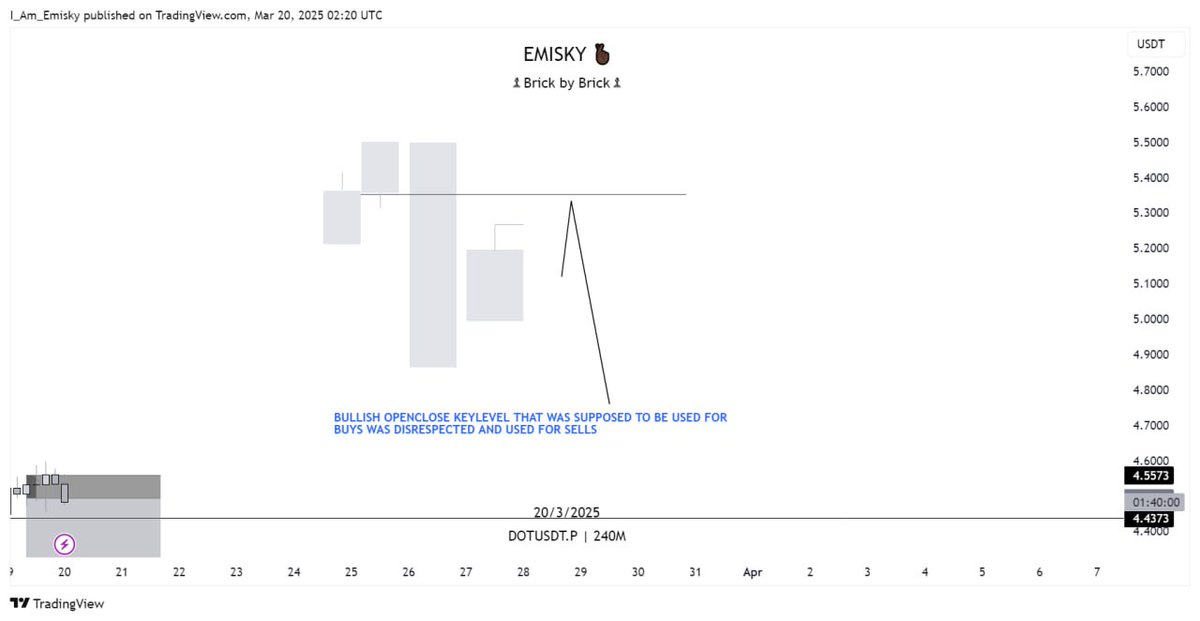
Here are some examples


Everything clear right? Now the question is, "How do I approach the market with all this information " Here we go.! Let me dazzle you a bit.