Canvas & Ratio
Choose your destination platform format
Layout Template
Choose a content structure for your slides
Preset Themes
Typography & Sizing
Brand Kit Customization
AGENCYConfigure brand assets for headers & footers
Outro Slide CTA
Customize your closing call-to-action slide
Background Pattern
Build Your Carousel
Drag and drop any post card below onto a slide, or use the quick buttons to insert content/images instantly!

My first 2 years as a day trader, I was unprofitable Its not until I switched over to swing trading that things really clicked for me Fast forward 4 years & I just had a +$100k month Below you can steal my exact swing trading strategy:🧵

To start off, we have to understand the point of this strategy.. We are trying to make trading super simple and keep things repeatable We only trade with size when the markets are strong & We reduce risk when markets are weaker, and no strong themes are present
1. Finding market strength and weakness The easiest way to find out if the markets are trending is to: Pull up a chart on <a target="_blank" href="https://www.tradingview.com/" color="blue">tradingview.com</a> and add the 8, 21, 50 EMA's EMA's can be used as a momentum gauge for when the markets are the hottest and stocks follow through the most.

2. Rules Now that we have the EMA's on the chart, we can make some rules for when we want to be active in the markets. Use $SPY / $QQQ 1) Whenever $SPY / $QQQ are above the 8/21/50 EMA's, we want to be long with full size/conviction 2) Whenever $SPY / $QQQ are below the 8/21/50 EMA's, we want to use smaller size or completely avoid trading This way we have a guide for when markets are going to be following through, and our strategy will be the most effective. We can also use this on the individual names we are swing trading to narrow down our criteria.
3. Sizing I have a tier system of risk as follows: My main position sizing is 3-5% of my account (I will use this size when trading leading stocks in leading sectors in a hot market) Second tier - is half size which will be 1-2% of account size(Will use this if i am trading a non leading name in a strong market) Third tier - small size tier risking 0.5%-1% of account(Will use this size if the market environment isn't optimal for my trading style)
4. Scanning for the strongest sectors Once we see that markets are staying above their moving averages... We start to look for leading names in leading sectors. Easiest way to scan for leading stocks is to use: <a target="_blank" href="https://finviz.com/groups.ashx" color="blue">finviz.com/groups.ashx</a> Look for the sectors that have had the strongest performance over the last week/1 month/ 3 month Communication services have been performing very well on the 1 week/1month/3 month trend. Now we can do a deep dive to pick out some names to trade.

5. Finding leading stocks You can then click on the communication services sector and see all the stocks in that sector. We want to narrow it down to some of the more liquid names. Here are some parameters i use: Price: Over $5 Market cap: Over $2b+ Average volume: Over 500k And most importantly, above the 20 EMA to find leading names in the sector.

Now we have some of the most liquid and strongest names in the sector To make our scanning even easier, we can head to the performance tab To sort the charts based on the strongest performance over the last month
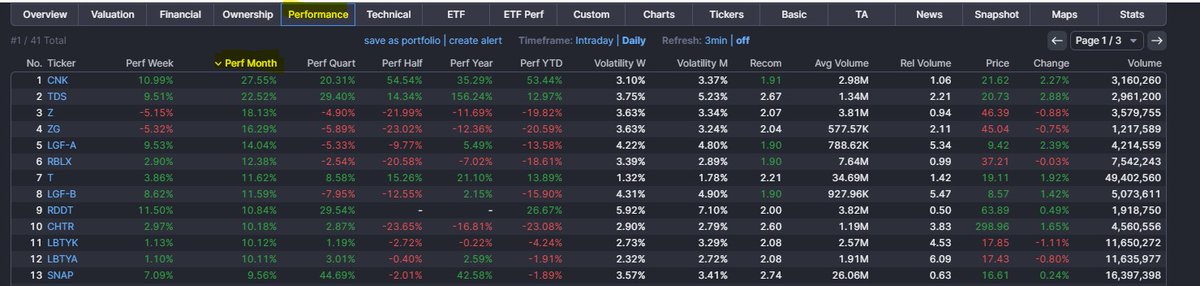
Head back over to charts and you should see a list of the strongest names, in one of the strongest sectors in the market You are now looking for a chart that is setting up in a tight base with some sort of chart pattern forming The goal is to find names that have not broken out yet, and are still setting up for a strong move out of their base The name that caught my attention is $RDDT $RDDT is setting up in a massive IPO cup and handle base that looks ready to breakout Price is above all the moving averages, showing strength in the market.

6. Entry level We can now pull up $RDDT on trading view We need to choose a level to trigger our entry What I look for, is a previous level of resistance that price has rejected multiple times In this example, you can see the $66 level is a big spot for price Price rejected $66 multiple times If price breaks over that level, then we can assume a daily breakout is likely to occur We want to confirm the breakout with lots of volume over the trigger level

Entry is taken on a break above the highs of the base... For confirmation, we want to see high volume on a break out of the base. For example $AAPL June base breakout: Leading stock in a leading sector/theme (Technology/AI) Breaking out of a daily base with volume Enter long at the break above the base.
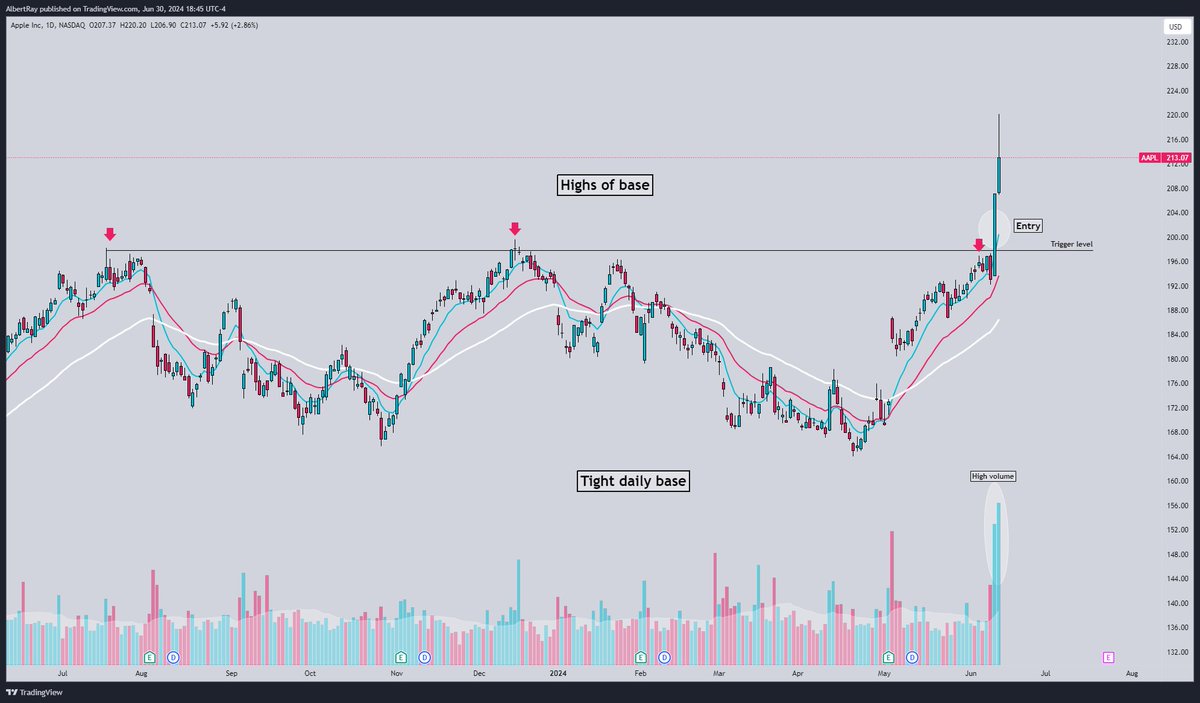
We can use the 5m time frame to confirm our entry. First 5m close above our level triggers long entry.

Stop loss is placed on the low of the daily breakout candle to make sure that we manage our risk in case of a failed breakout.

7. Targets Take profits at previous resistance levels If price is making new all time highs, use Fibonacci levels to scale out. My scale out strategy is 25% of the position at a time and moving up stop to break even after first trim. If markets aren't following through, I trim 50% on the first target.

The goal is to adjust your risk as the market shows you signs of weakness or strength... We want more risk when markets are strong and hot & We want smaller risk when conditions are choppier/less follow through. We also want to find about 4-5 names in the strongest sectors and create a watchlist/focus list to use to trigger our entries Everything should be pre planned
This strategy works so well because we are trading the names that are getting the most flows, whether it be due to a catalyst like the AI hype or a technical move. We are also taking on majority of the risk when the markets are strongest and breakouts are working the best.
Like any other strategy this is not a holy grail strategy but there's a reason why some of the best traders in the world swing strong names, and buy leading stocks in leading sectors. I've personally used this strategy to trade names like: $NVDA $SMCI $MSFT $GOOGL $AMZN $LLY Just this year and caught huge 25%+ breakouts
I post these setups every night on my twitter with trigger levels, option contracts, and targets. So you can follow along, and learn the strategy. If you enjoyed and learned something from this thread LIKE+RT❤️for more trade plans and educational threads.
I also posted a full video on my strategy here: Check it out and follow the Tiktok for more sauce👇 <a target="_blank" href="https://www.tiktok.com/@sean.rechtman/video/7386422351409302814" color="blue">tiktok.com/@sean.rechtman…</a>