US stock market has rallied +25% in just 60 trading days
This has only happened 8 times since the 1970s
Here’s what typically happens next
A thread 🧵


2/ We just sold most of our US stock market exposure on our website
The S&P 500 is at all-time highs after a spectacular melt-up
We've been holding multiple tech and industrial trades over the last few months
But we've now sent out sell alerts to all of our clients
The S&P 500 is at all-time highs after a spectacular melt-up
We've been holding multiple tech and industrial trades over the last few months
But we've now sent out sell alerts to all of our clients

3/ We're making this move because we believe a major opportunity is coming in the next month
And we want to be ready to take advantage of it
Also, this is your last chance to use our 4th of July 30% DISCOUNT
Only a few hours left before it expires
And we want to be ready to take advantage of it
Also, this is your last chance to use our 4th of July 30% DISCOUNT
Only a few hours left before it expires

4/ When you join, you'll get full access to our trading strategy
With real-time buy and sell alerts
You can also see our 2025 track record for FREE on the homepage at:
bit.ly/BravosResearch
With real-time buy and sell alerts
You can also see our 2025 track record for FREE on the homepage at:
bit.ly/BravosResearch
5/ This marks our biggest portfolio shift since March
When we also exited most of our stock exposure due to rising trade war risks
But the current situation is very different from back then
When we also exited most of our stock exposure due to rising trade war risks
But the current situation is very different from back then

6/ First of all, trade war tensions were escalating back in March
Today, they’ve cooled off significantly
And you can see this shift clearly in the market’s price action
Today, they’ve cooled off significantly
And you can see this shift clearly in the market’s price action
7/ In March, the S&P 500 had broken below key moving averages
Signaling the end of the uptrend from the previous year
The moving averages were also curling downward
Showing momentum was shifting to the downside
Signaling the end of the uptrend from the previous year
The moving averages were also curling downward
Showing momentum was shifting to the downside

8/ Today, we’re seeing the opposite
The S&P 500 has crossed back above those same moving averages
Which are now curling upward
We’ve even seen a golden cross, where the 50-day MA crosses above the 200-day MA
The S&P 500 has crossed back above those same moving averages
Which are now curling upward
We’ve even seen a golden cross, where the 50-day MA crosses above the 200-day MA

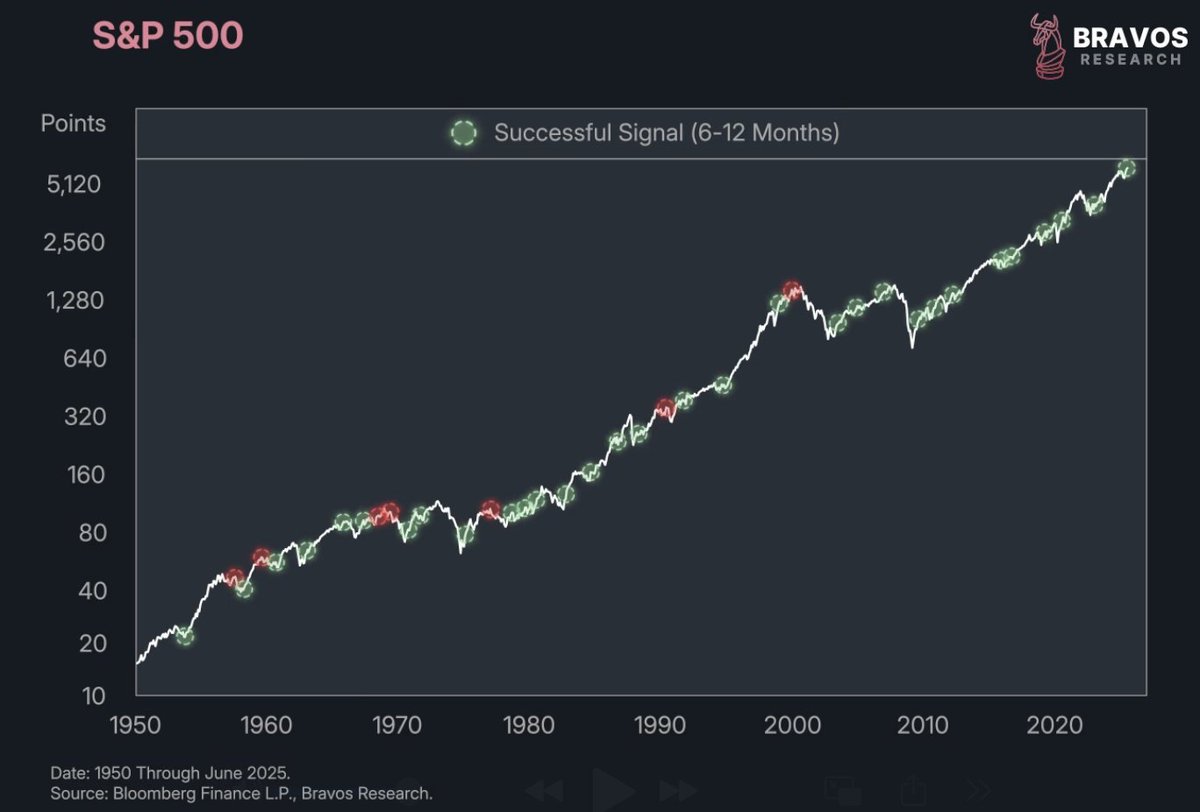
9/ The golden cross is a well-known technical signal that typically suggests momentum is returning and prices can keep rising
The last one occurred in early 2023, right at the start of a major rally that lasted through 2024
The last one occurred in early 2023, right at the start of a major rally that lasted through 2024

10/ The previous golden cross before that was in 2020
Again, right at the start of a huge bull run
And before that, in 2019, just ahead of another major move higher
Again, right at the start of a huge bull run
And before that, in 2019, just ahead of another major move higher

11/ Since the 1950s, there have been 37 golden crosses on the S&P 500
Of those, 30 led to higher prices over the following 6 to 12 months
It's a strong track record and aligns well with our view that the economy will stay resilient over the next 6-12 months
Of those, 30 led to higher prices over the following 6 to 12 months
It's a strong track record and aligns well with our view that the economy will stay resilient over the next 6-12 months
12/ Real GDP growth in the US remains in the 2–3% range
This is a healthy range that often supports steady and sustained bull markets
So if everything looks so constructive… why did we just exit most of our major long trades?
This is a healthy range that often supports steady and sustained bull markets
So if everything looks so constructive… why did we just exit most of our major long trades?

13/ Because in just 60 trading sessions, the S&P 500 has surged 25%
We’ve only seen this kind of return a handful of times
We’ve only seen this kind of return a handful of times

14/ Since 1970, this 25% surge over 60 sessions has only happened 8 times
And at first glance, all of them look like great times to be buying stocks
And at first glance, all of them look like great times to be buying stocks

15/ But take the 2020 example: the S&P hit that 25% return on June 5
What happened next?
An 8% correction followed almost immediately after
What happened next?
An 8% correction followed almost immediately after

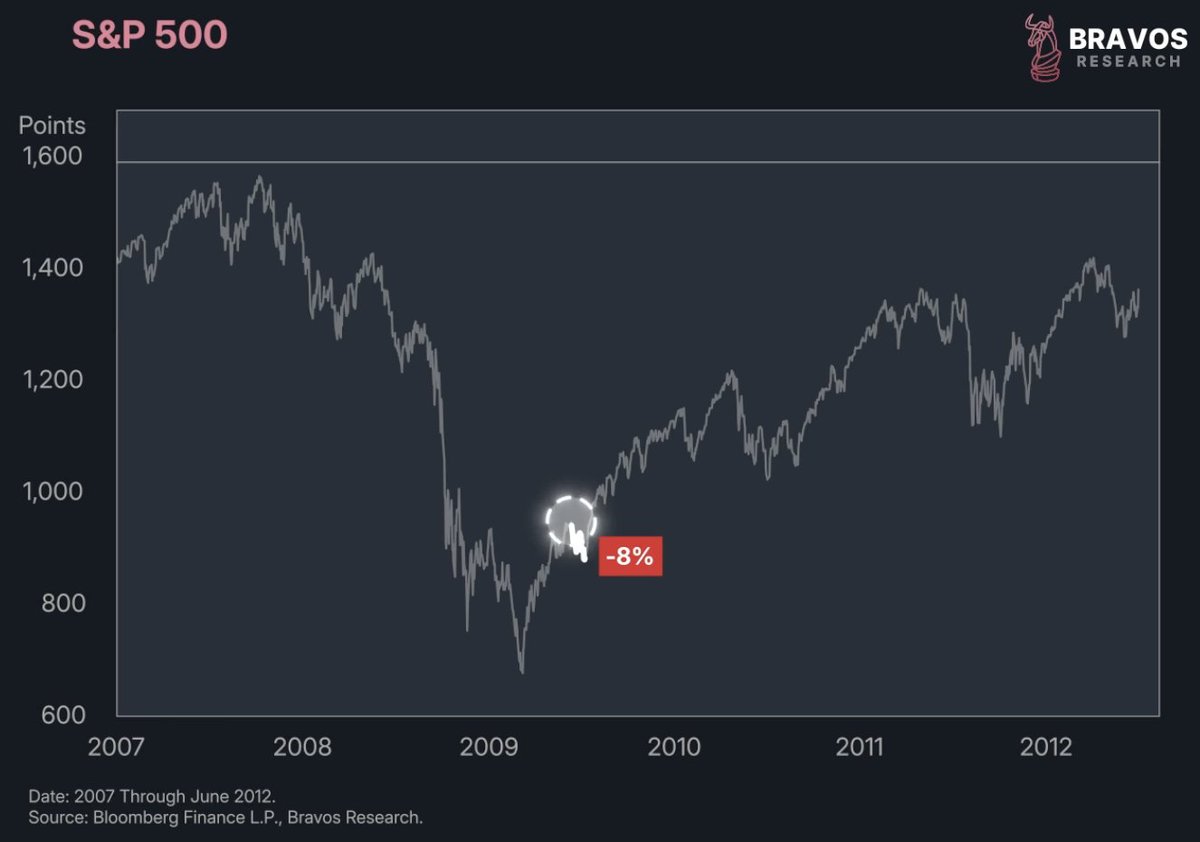
16/ Same thing happened in 2009
After a similar 25% return in just 60 sessions, the S&P 500 corrected by around 8% over the following months
After a similar 25% return in just 60 sessions, the S&P 500 corrected by around 8% over the following months
17/ We won’t go through every case here, but we’ve reviewed them all
And in 100% of the instances where the S&P had this kind of rapid rally, it pulled back in the next month or 2
Even if it was shallow or brief, some turbulence always followed
And in 100% of the instances where the S&P had this kind of rapid rally, it pulled back in the next month or 2
Even if it was shallow or brief, some turbulence always followed

18/ In just a second, we’ll walk through how we plan to take advantage of this setup at Bravos Research
But first, one more thing that supports our short-term view:
The S&P 500 has been tracking the 4-year presidential election market cycle almost perfectly
But first, one more thing that supports our short-term view:
The S&P 500 has been tracking the 4-year presidential election market cycle almost perfectly
19/ This cycle maps out how the stock market tends to behave during each year of a US presidential term:
Election year, post-election year, midterm year, and pre-election year - based on 100 years of data
Election year, post-election year, midterm year, and pre-election year - based on 100 years of data

20/ While we don’t treat market seasonality as a primary signal, it helps frame how investor behavior tends to shift around elections
And this year, the S&P has been following the seasonal pattern almost perfectly
And this year, the S&P has been following the seasonal pattern almost perfectly
Generated by Thread Navigator
Press ⌘ + S to quick-export