@bravosresearch: Every time this line turns neg...
@bravosresearch
29 views
Apr 02, 2026
Advertisement
1
Every time this line turns negative, stocks have entered a bear market
We saw this in the 1970s, 1999, 2007, 2022
And it’s about to happen again…
A Thread 🧵
We saw this in the 1970s, 1999, 2007, 2022
And it’s about to happen again…
A Thread 🧵

2
2/ The US stock market has wiped out nearly $4.1 trillion in value since the start of 2026.
The S&P 500 index has just broken below a key level where buyers have previously stepped in.
And the NASDAQ 100 index is in a similar vulnerable position.
The S&P 500 index has just broken below a key level where buyers have previously stepped in.
And the NASDAQ 100 index is in a similar vulnerable position.

3
3/ In recent weeks Donald Trump has been trying to reach a ceasefire deal.
Following this announcement, Oil prices fell roughly 9% before rebounding.
But even with the drop, oil prices are still about 40% higher than where they were before the conflict.
Following this announcement, Oil prices fell roughly 9% before rebounding.
But even with the drop, oil prices are still about 40% higher than where they were before the conflict.

4
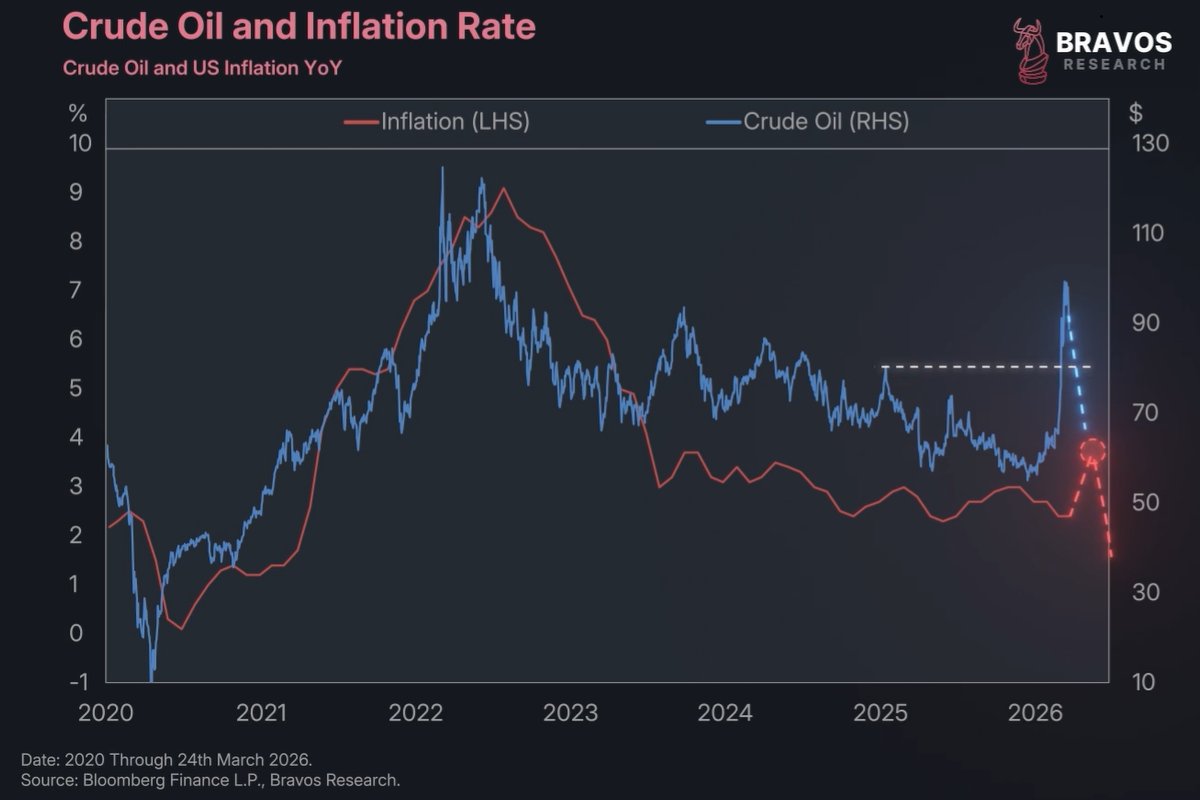
4/ We know that the inflation data in the US is heavily influenced by the price of oil.
Oil is both a direct component of the CPI and an indirect driver through the energy that it provides to power the economy.
On top of that, oil is far more volatile than other major components of CPI like shelter, for example.
Oil is both a direct component of the CPI and an indirect driver through the energy that it provides to power the economy.
On top of that, oil is far more volatile than other major components of CPI like shelter, for example.

5
5/ The recent spike in oil has not yet been reflected by the actual government inflation data for March 2026.
That’s simply because the government's data gets released with a monthly delay.
But a 40% jump in oil prices would push inflation higher, likely toward 3.5% - 4% in the next print.
This is going to completely change how the US stock market is priced.
That’s simply because the government's data gets released with a monthly delay.
But a 40% jump in oil prices would push inflation higher, likely toward 3.5% - 4% in the next print.
This is going to completely change how the US stock market is priced.

6
6/ One of the main reasons we’ve been bullish on equities over the past few years is that inflation has been trending lower.
Historically, lower inflation numbers have been associated with some of the strongest market rallies, and that was our core thesis.
But in just the past few weeks, that view has shifted significantly due to the recent inflation dynamics.
Historically, lower inflation numbers have been associated with some of the strongest market rallies, and that was our core thesis.
But in just the past few weeks, that view has shifted significantly due to the recent inflation dynamics.

7
7/ Inflation is at the center of the financial system.
When inflation moves up and down it makes certain asset classes more or less attractive to investors.
Ideally, an investor wants asset return to exceed the rate of inflation.
When inflation moves up and down it makes certain asset classes more or less attractive to investors.
Ideally, an investor wants asset return to exceed the rate of inflation.

8
8/ For instance investing $100 in a company which is earning $5/share gives us a 5% return.
If the inflation is at 2%, then the inflation-adjusted or real return will be 3%, which is +ve.
But if the inflation jumps to 6%, then the real return drops to -1%.
It means money is being lost by staying invested in that stock as a result of high inflation.
This is the exact shift that is about to take place on the US stock market.

9
9/ Investors in the S&P 500 are essentially paying $6,600/share.
This generates an annual return of nearly $234, equating to almost 3.5%.
And inflation in early 2026 was averaging around 2.5%.
So before the war broke out, the S&P 500 index was generating a real return on investment of 1%.
This generates an annual return of nearly $234, equating to almost 3.5%.
And inflation in early 2026 was averaging around 2.5%.
So before the war broke out, the S&P 500 index was generating a real return on investment of 1%.

10
10/ In other words, because of low inflation investors haven’t really had to question whether the market is too expensive.
Because when inflation is stable and trending lower that is really not a concern for investors.
But now, inflation is rising and it could reach around 4% quickly.
This can wipe out the S&P 500’s real returns and likely push it into -ve territory.
Because when inflation is stable and trending lower that is really not a concern for investors.
But now, inflation is rising and it could reach around 4% quickly.
This can wipe out the S&P 500’s real returns and likely push it into -ve territory.

11
11/ Most investors are focused on the risks right now, but they are missing the opportunity.
There are 3 areas of the market we’re actively positioning in that could significantly outperform in this environment.
We break them down step-by-step in this FREE video:
go.bravosresearch.com/InvestmentRepo…
There are 3 areas of the market we’re actively positioning in that could significantly outperform in this environment.
We break them down step-by-step in this FREE video:
go.bravosresearch.com/InvestmentRepo…
12
12/ Historically, the real returns of the S&P 500 rarely enters -ve territory.
But when it does happen it is absolutely catastrophic for the stock market.
This chart shows the real earnings yield of the S&P 500 index going back to the 1960s.
And we see there's only a handful of moments where the earnings yield dipped -ve.
But when it does happen it is absolutely catastrophic for the stock market.
This chart shows the real earnings yield of the S&P 500 index going back to the 1960s.
And we see there's only a handful of moments where the earnings yield dipped -ve.

13
13/ Each of these years coincided with an economic recession.
That means that every single time where the real earnings yield went -ve , the stock market experienced at least a 20% correction from its all-time high.
And the reason for this is pretty straightforward…
That means that every single time where the real earnings yield went -ve , the stock market experienced at least a 20% correction from its all-time high.
And the reason for this is pretty straightforward…

14
14/ When investors realize that they are literally losing money by staying invested in the stock market they begin to sell.
And that selling causes the price of stocks to go down.
In other words, this is when valuations really start to matter.
For the last 3-years, investors have gotten used to seeing stock market valuations rise for no apparent reason.
And that selling causes the price of stocks to go down.
In other words, this is when valuations really start to matter.
For the last 3-years, investors have gotten used to seeing stock market valuations rise for no apparent reason.

15
15/ Metrics like the Schiller PE ratio have reached very high levels in the last few years.
This has raised questions about how markets kept climbing higher despite underlying economic weakness.
In our view valuations will continue to rise as long as inflation remains low.
But as soon as inflation comes back into the picture, that's when high valuations can start to unwind.
This has raised questions about how markets kept climbing higher despite underlying economic weakness.
In our view valuations will continue to rise as long as inflation remains low.
But as soon as inflation comes back into the picture, that's when high valuations can start to unwind.

16
16/ We’ve seen this dynamic play out before in 1999 and 1967.
In both of these cases, low and stable levels of inflation led to a large run-up in the valuations of the stock market.
And then a sudden jump in inflation data led to a reversal of those valuations.
The current surge in energy prices has the potential to trigger a similar outcome.
In both of these cases, low and stable levels of inflation led to a large run-up in the valuations of the stock market.
And then a sudden jump in inflation data led to a reversal of those valuations.
The current surge in energy prices has the potential to trigger a similar outcome.

17
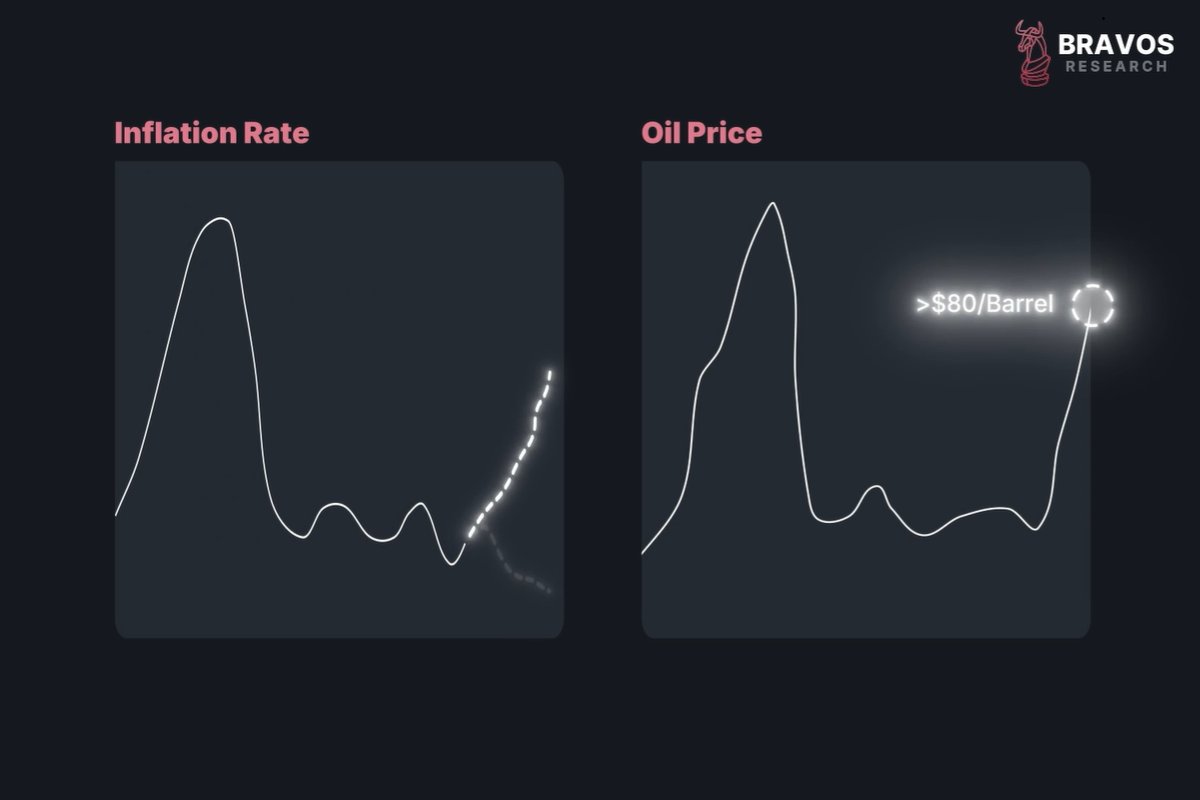
17/ Now ,there is still a scenario where the stock market can actually make it out okay.
And that will happen if the oil prices come back below $80/barrel.
If that happens then everything that was highlighted up until now would be invalidated.
And there are 2 reasons for this.
And that will happen if the oil prices come back below $80/barrel.
If that happens then everything that was highlighted up until now would be invalidated.
And there are 2 reasons for this.

18
18/ First, in the past 3 instances where oil prices went above $80/barrel, the S&P 500 index fell, similar to today.
On the flip side, each time that oil prices were below $80/barrel the stock market for the most part was actually rising.
$80 a barrel level has effectively acted as a dividing line for investor concern around energy prices.
On the flip side, each time that oil prices were below $80/barrel the stock market for the most part was actually rising.
$80 a barrel level has effectively acted as a dividing line for investor concern around energy prices.

19
19/ The second reason is that if oil prices quickly come back down, the overall impact on inflation would be very limited.
Yes, there would likely be a temporary jump but it would quickly fade allowing stock market valuations to remain elevated.
The issue is that multiple structural forces are pushing commodity prices higher beyond just the Iran conflict.
Yes, there would likely be a temporary jump but it would quickly fade allowing stock market valuations to remain elevated.
The issue is that multiple structural forces are pushing commodity prices higher beyond just the Iran conflict.
20
20/ A key structural force is the long-term cycle in commodity prices.
Going back 100-years, significant commodity price appreciation led to higher inflation.
Conversely, long periods of commodity price decline, such as the late 1960s or late 1990s, correlate with low and stable inflation.
Going back 100-years, significant commodity price appreciation led to higher inflation.
Conversely, long periods of commodity price decline, such as the late 1960s or late 1990s, correlate with low and stable inflation.

21
21/ The reason for these cycles is that commodity prices are mean reverting.
In simple terms:
High commodity price → Over-investment → Over-supply → Price falls.
Low commodity price → Lack of investment → Shortage → Price rise.
In simple terms:
High commodity price → Over-investment → Over-supply → Price falls.
Low commodity price → Lack of investment → Shortage → Price rise.

22
22/ Currently, we are experiencing an upswing in the price of commodities.
This move is further boosted by the loss of purchasing power of the US dollar, as can be seen by rising gold prices.
This move is further boosted by the loss of purchasing power of the US dollar, as can be seen by rising gold prices.
23
23/ We also know that the commodities market remains a very under-invested space.
The market share of commodity related ETFs is barely 3% of the entire ETF market.
In 2011, at the peak of the last commodities upswing this figure stood at 12%.
The market share of commodity related ETFs is barely 3% of the entire ETF market.
In 2011, at the peak of the last commodities upswing this figure stood at 12%.

24
24/ In other words, there is still significant room for investors to allocate more capital to commodities, dragging prices higher.
This would put structural upwards pressure on the price of oil and many other raw materials.
So although inflation could come down, there are arguments to be made for why it might not.
And this is why as long as oil prices remain above $80 a barrel, we're staying very cautious on US stocks and specifically technology stocks.
25
25/ However, there are still a few key opportunities that are flying under the radar.
We’ve identified 3 sectors with strong upside potential even in the current macro environment.
You can watch the full breakdown in this FREE video below:
go.bravosresearch.com/InvestmentRepo…
We’ve identified 3 sectors with strong upside potential even in the current macro environment.
You can watch the full breakdown in this FREE video below:
go.bravosresearch.com/InvestmentRepo…
26
26/ Thanks for reading!
If you enjoyed this thread, please ❤️ and 🔁 the first tweet below
And follow @bravosresearch for more market insights, finance and investment strategies
If you enjoyed this thread, please ❤️ and 🔁 the first tweet below
And follow @bravosresearch for more market insights, finance and investment strategies
View Tweet